
The setup
Winbond is the Taichung company that has spent most of its listed life being the memory maker nobody modelled. It does not make HBM. It does not make DDR5 for servers. It makes niche DRAM — DDR3, DDR4, LPDDR4, pseudo-SRAM, known-good-die — plus NOR flash and SLC NAND, on 16nm, 20nm, 25nm and 46nm, for customers whose product qualification files run to a decade and whose alternative supplier list is one name long. For years that positioning meant the stock traded as a proxy for the consumer-electronics cycle and the P&L swung between thin profits and losses.
Then three things happened at once. Samsung, SK hynix and Micron moved capacity out of DDR3 and DDR4 and into HBM, which removed the marginal supplier from a market that still has to be served. Every AI rack turned out to need a great deal of high-density NOR to hold firmware — Chen Pei-ming put it at 500 to 600 NOR chips per rack, of which Winbond supplies 40 to 50% — and the parts in question are 512Mb to 2Gb devices, the high-density end where Winbond's share is concentrated. And automotive and industrial buyers, who had spent two years working down inventory, came back to a market with no slack in it. Chen's line from the Q1 call is the one to keep: "We couldn't see customers before; now everyone is reachable."
That is the demand backdrop, and it is well understood. The interesting part of this print is not that Winbond made a lot of money. It is how the money arrived.
The numbers
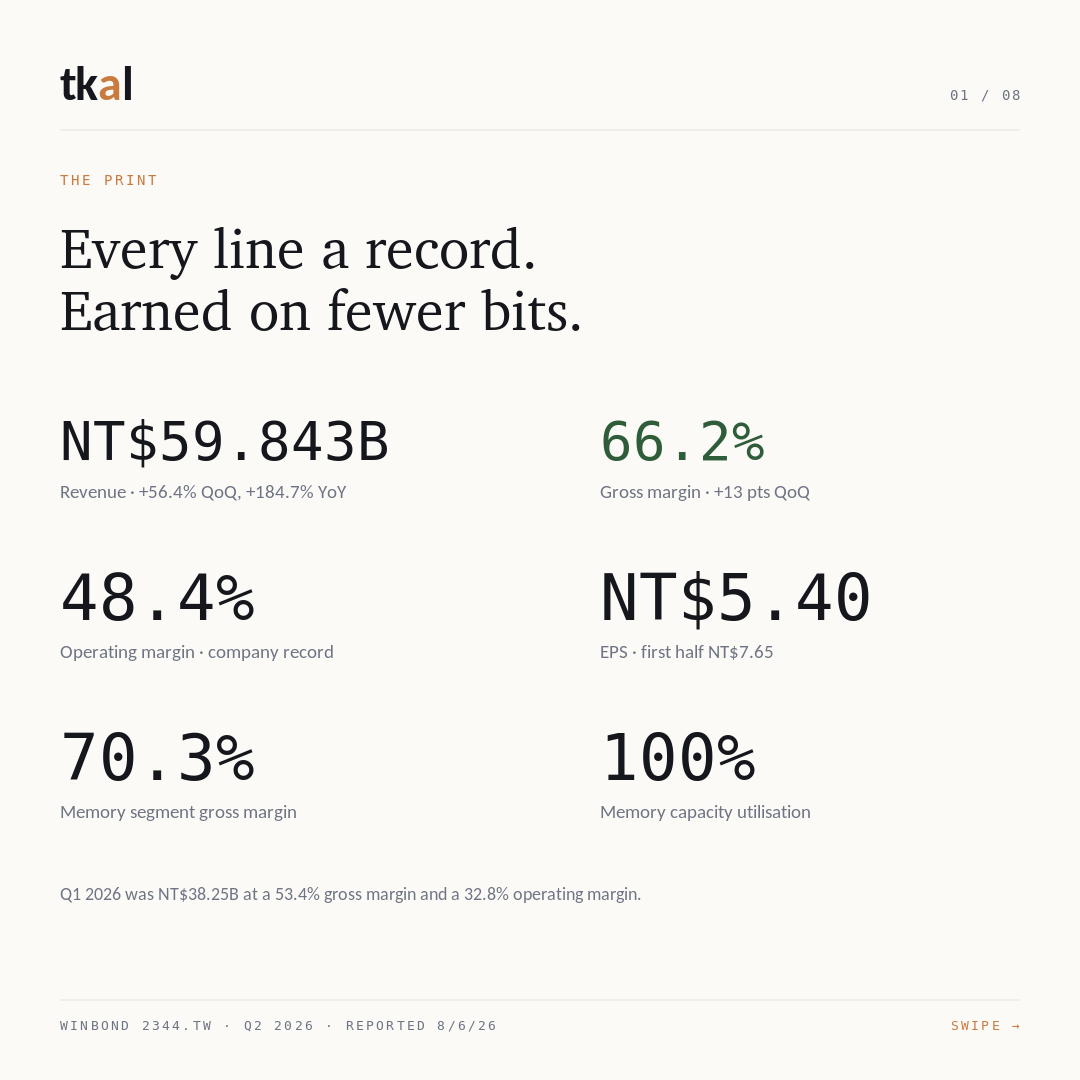
Records on every line. Consolidated revenue of NT$59.843B (≈US$1.9B) rose 56.4% sequentially and 184.7% year-on-year. Gross margin was 66.2%, up 13 points from Q1's 53.4% and roughly 44 points above the year-ago quarter. Operating profit was NT$28.98B at a 48.4% operating margin. Net profit attributable to the parent was NT$24.317B, up 140.4% sequentially, giving EPS of NT$5.40 and a first-half total of NT$7.65. EBITDA was NT$33.64B in the quarter and NT$49.77B in the half. Free cash flow was NT$18.1B in the quarter, the debt-to-equity ratio fell to 0.69, and book value per share went from NT$23.99 at the end of last year to NT$36.67.
| Metric | 2026 Q2 | 2026 Q1 | QoQ | YoY |
|---|---|---|---|---|
| Consolidated revenue (NT$B) | 59.843 | 38.25 | +56.4% | +184.7% |
| Gross margin | 66.2% | 53.4% | +13pp | +44pp |
| Operating profit (NT$B) | 28.98 | 12.50 | +131.8% | n/m |
| Operating margin | 48.4% | 32.8% | +15.6pp | record |
| Net profit attributable (NT$B) | 24.317 | 10.12 | +140.4% | n/m |
| EPS (NT$) | 5.40 | 2.25 | +140.0% | 1H: 7.65 |
| Memory segment revenue (NT$B) | 51.7 | 29.92 | +72.8% | — |
| Memory gross margin | 70.3% | 56.6% | +13.7pp | util. 100% |
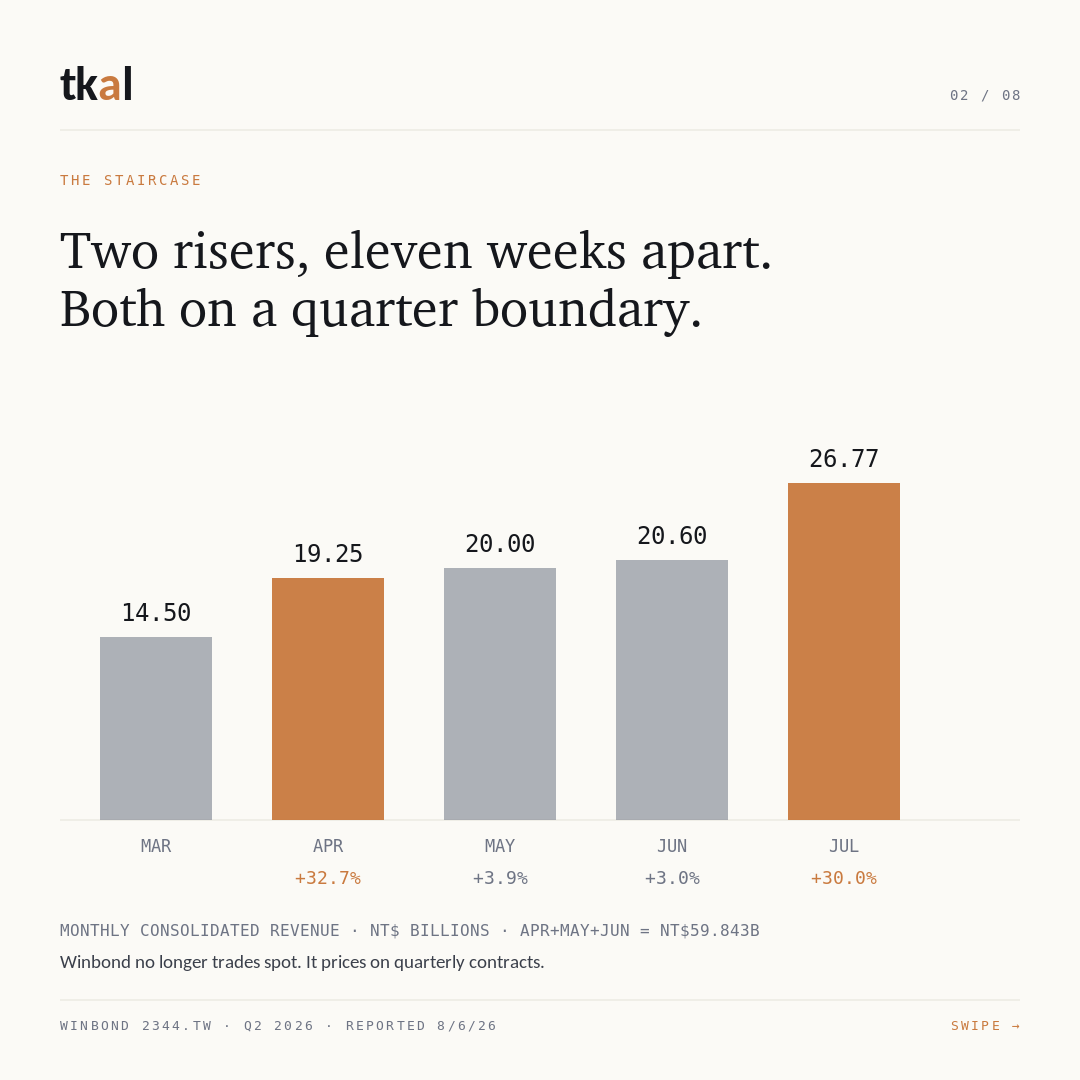
The quarter reconciles against the monthly filings to the last digit, which is worth doing because it is where the finding is. April NT$19.245B + May NT$20.001B + June NT$20.597B = NT$59.843B — exactly the reported consolidated figure. Q1 ties the same way: NT$11.78B + NT$11.97B + NT$14.50B = NT$38.25B. Now put the sequential changes in a row. April +32.7%, May +3.9%, June +3.0%, July +30.0% to a record NT$26.773B. That is not a growth curve. It is a step function with two risers eleven weeks apart, and both risers land on the first day of a calendar quarter.
Chen said why, in the Q&A, in a sentence that was reported as housekeeping: Winbond no longer engages in spot transactions, and prices primarily on quarterly contracts, with LTA customers quoted quarterly or annually. A company that has removed spot from its revenue mix cannot reprice in the middle of a quarter. So the ASP moves on four dates a year, volume drifts inside the quarter, and the monthly sheet renders exactly what it rendered here — a jump, two flat months, a jump. The 56.4% sequential increase in Q2 was, in mechanical terms, one April repricing carried across three months.
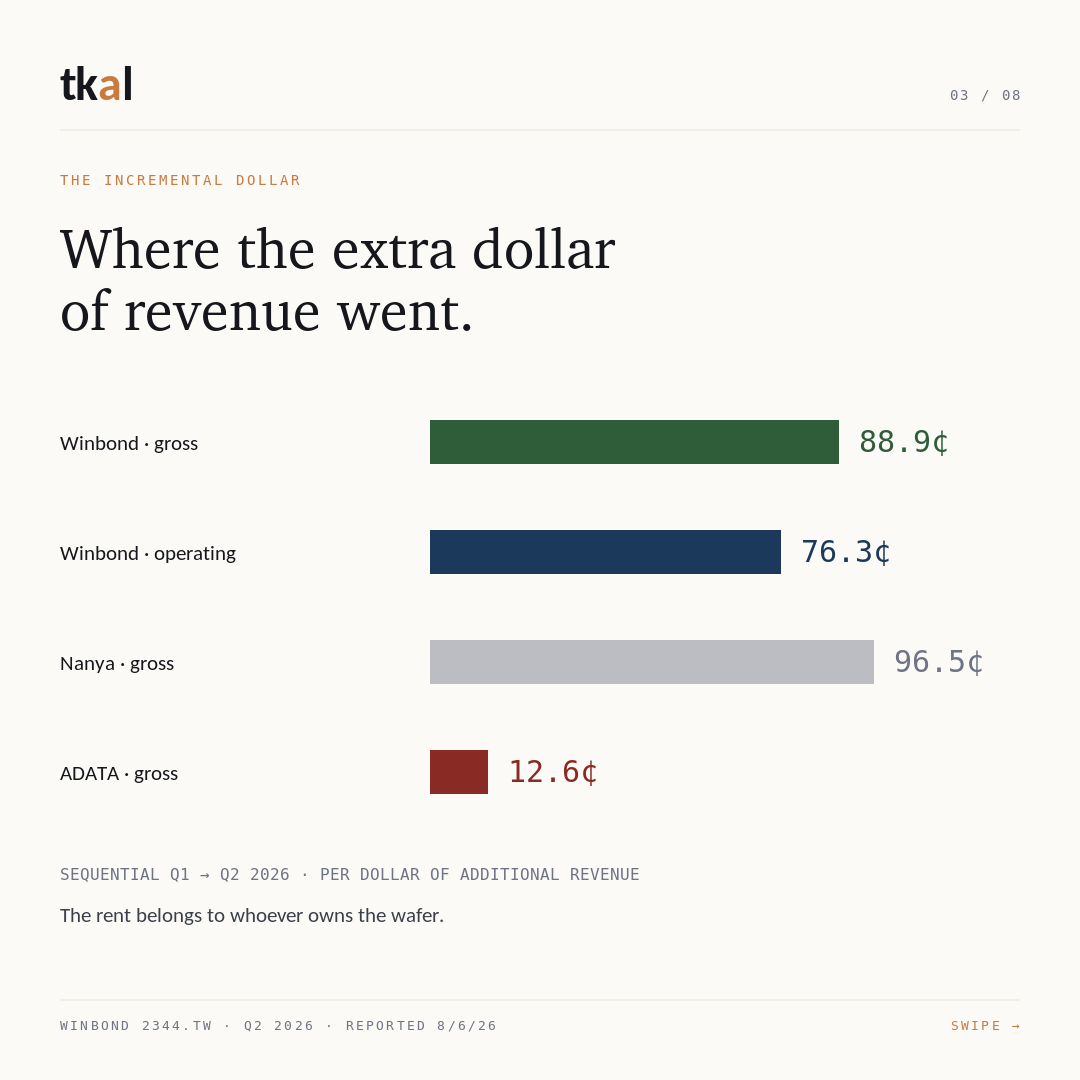
Run the increment and the quarter states its own character. On NT$21.593B of additional sequential revenue, Winbond kept NT$19.19B of additional gross profit and NT$16.48B of additional operating profit — 88.9 cents and 76.3 cents on the incremental dollar, against reported averages of 66.2% and 48.4%. Operating expenses rose 34.2% while revenue rose 56.4%, which cost about 2.9 points of the margin expansion and is the only line in the P&L that behaved like a normal quarter. For scale: ADATA, buying its bits rather than making them, kept 12.6 cents of gross profit and 4.0 cents of operating profit on its incremental dollar the same quarter. Nanya, which owns its fab, kept 96.5 cents of gross. The rent belongs to whoever owns the wafer, and this print is another receipt for it.
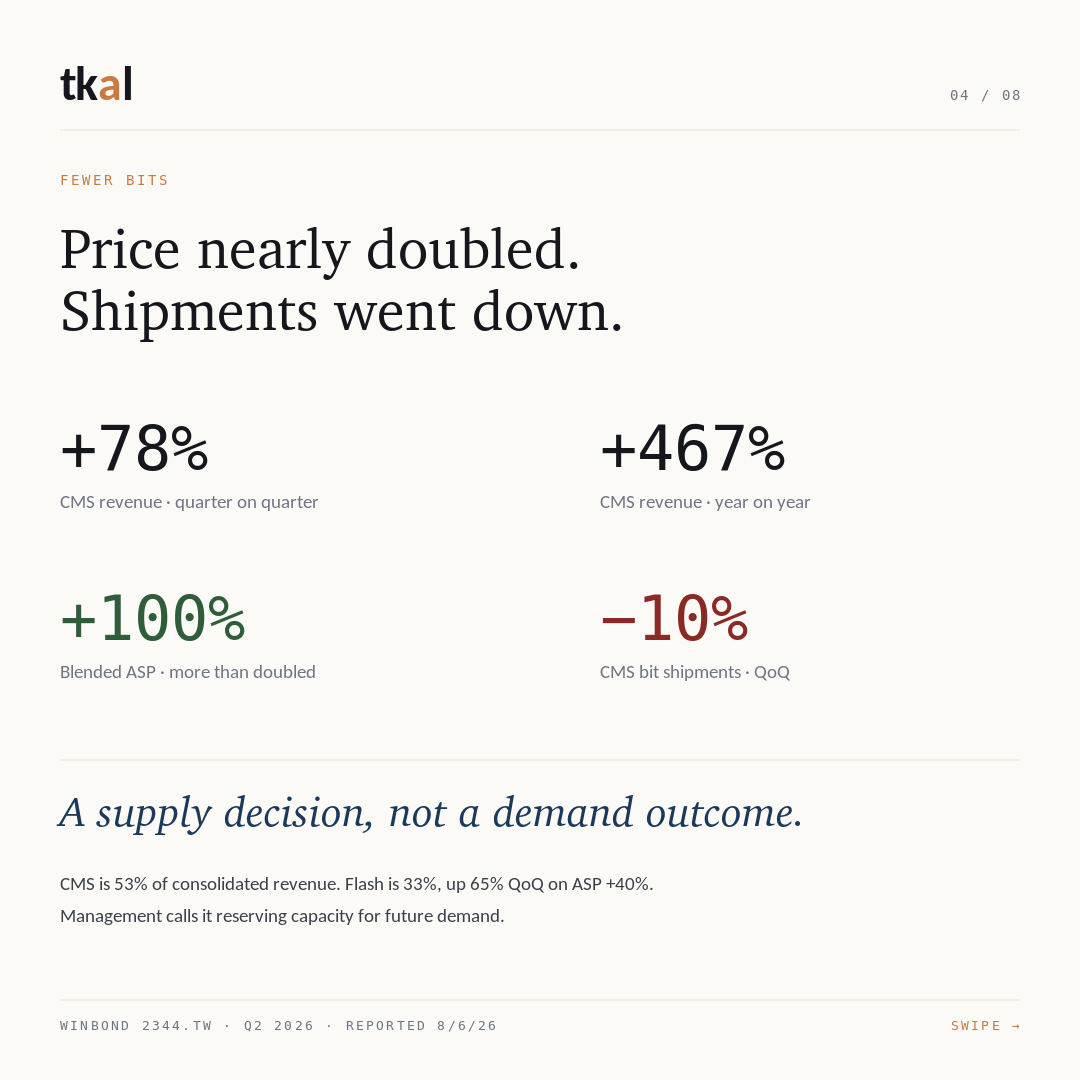
The part that is genuinely unusual sits one level down. CMS — the customised memory and DRAM line, 53% of consolidated revenue — grew 78% sequentially and 467% year-on-year with blended ASP up more than 100%, and bit shipments fell roughly 10% QoQ. Flash, 33% of revenue, grew 65% sequentially and 176% year-on-year on ASP up over 40%. Logic IC was 13% and other 1%. So the largest revenue line in the company nearly doubled its price and shipped fewer units into the tightest market it has ever seen, and management described that as reserving capacity for future demand. That is a supply decision, not a demand outcome, and it is the thing that makes the next four quarters modellable in a way memory quarters usually are not.
The rest of this dive is for paid subscribers.
The headline numbers are above. The 6 sections below carry the mechanism, the peer read, the valuation work, and the dated tests that decide it.
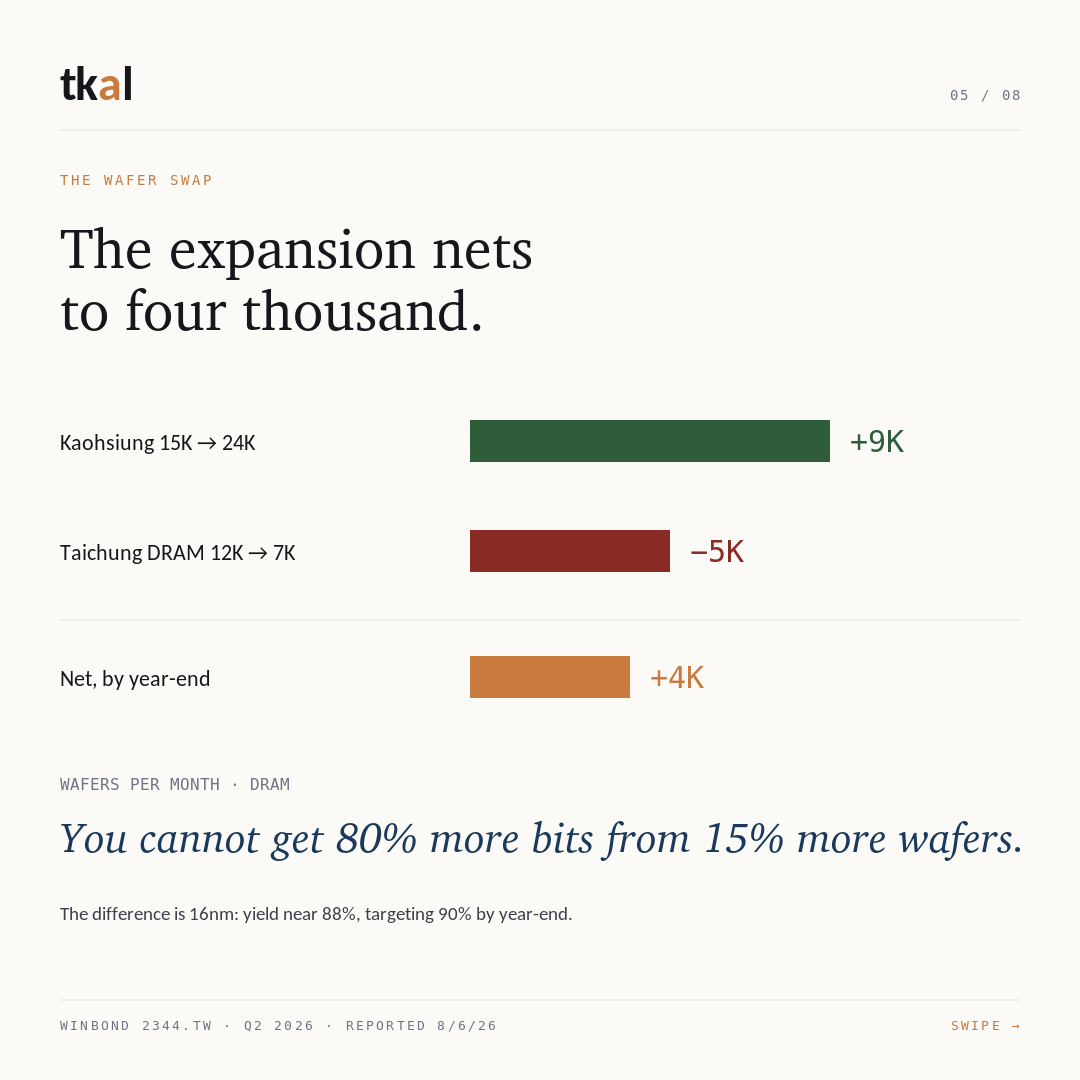
- What's actually driving it — the wafer swap, and why "expansion" nets to +4K
- The NT$25B that arrived in book value and not in earnings
- How peers read this — NOR, niche DRAM, the module buyers, and Si-Cap
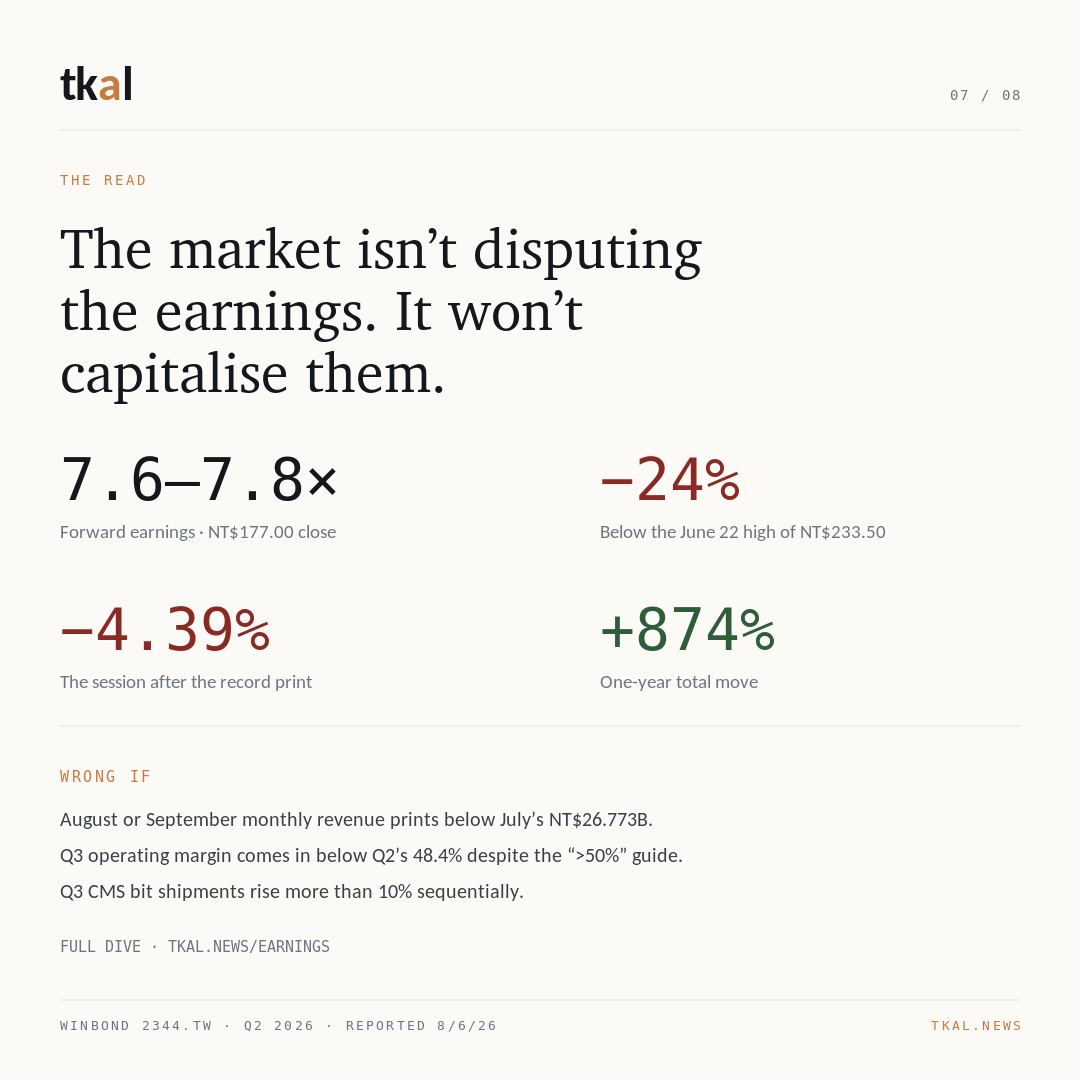
- Valuation reality check — a record print, and a stock 24% off its June high
- What we'd watch from here — including the reset
- The trade, the listed-market read-through, and the bottom line
Already a subscriber? Sign in.