
tkalAI Capital Flows
Earnings deep dive · Synthesis edition · Tier M memory & storage

Longsys H1 2026 — The Warehouse Is the Position. In Q2 It Started Paying.

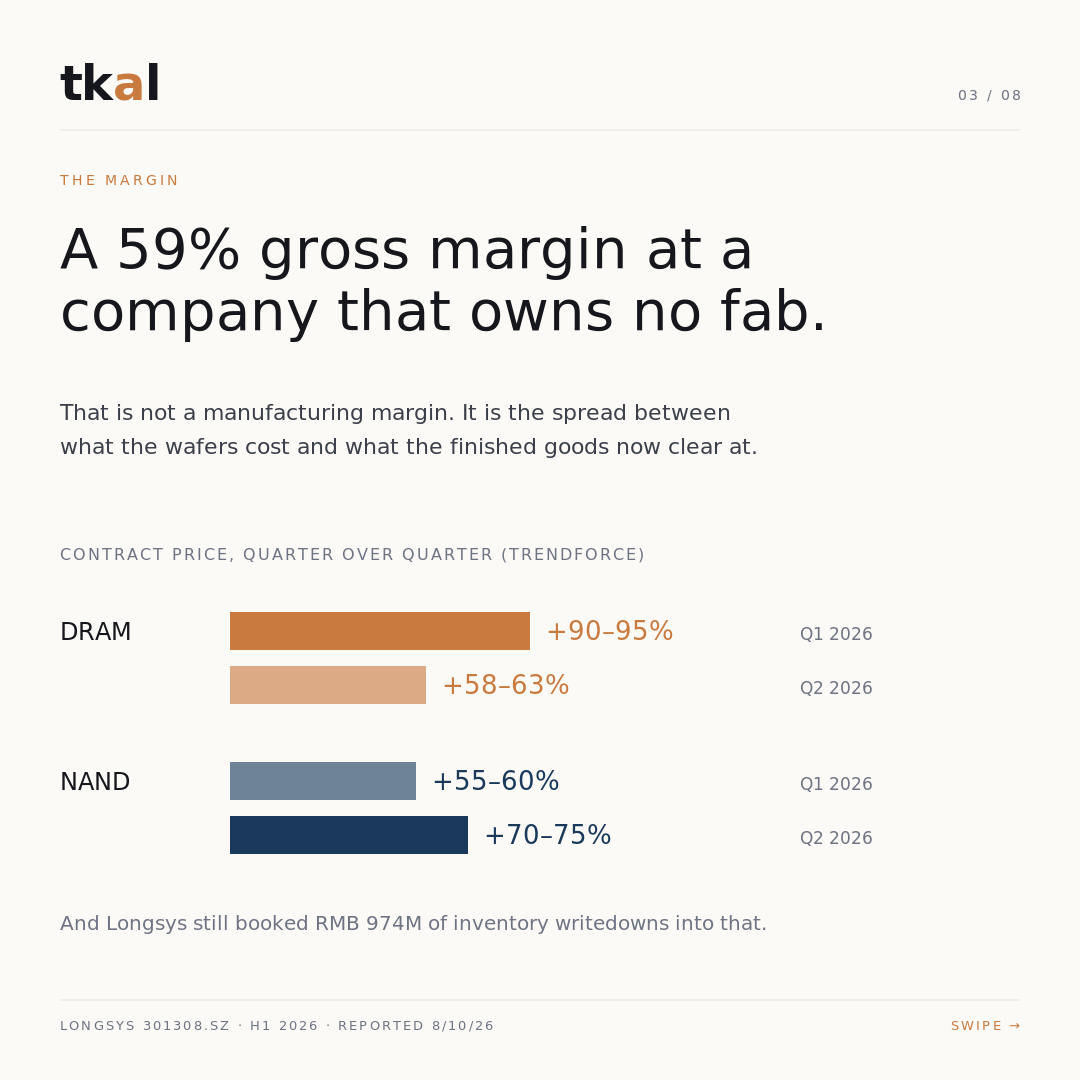
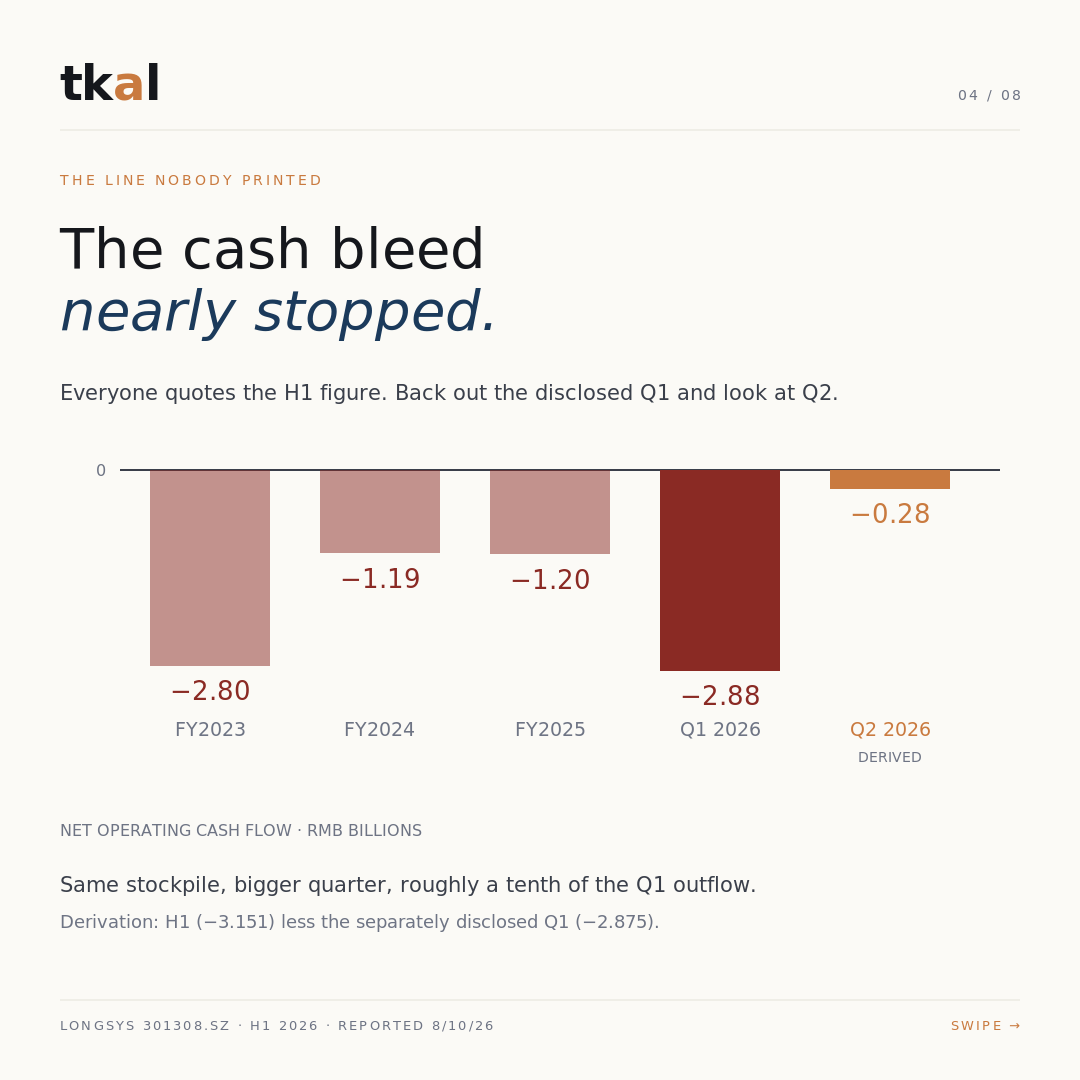
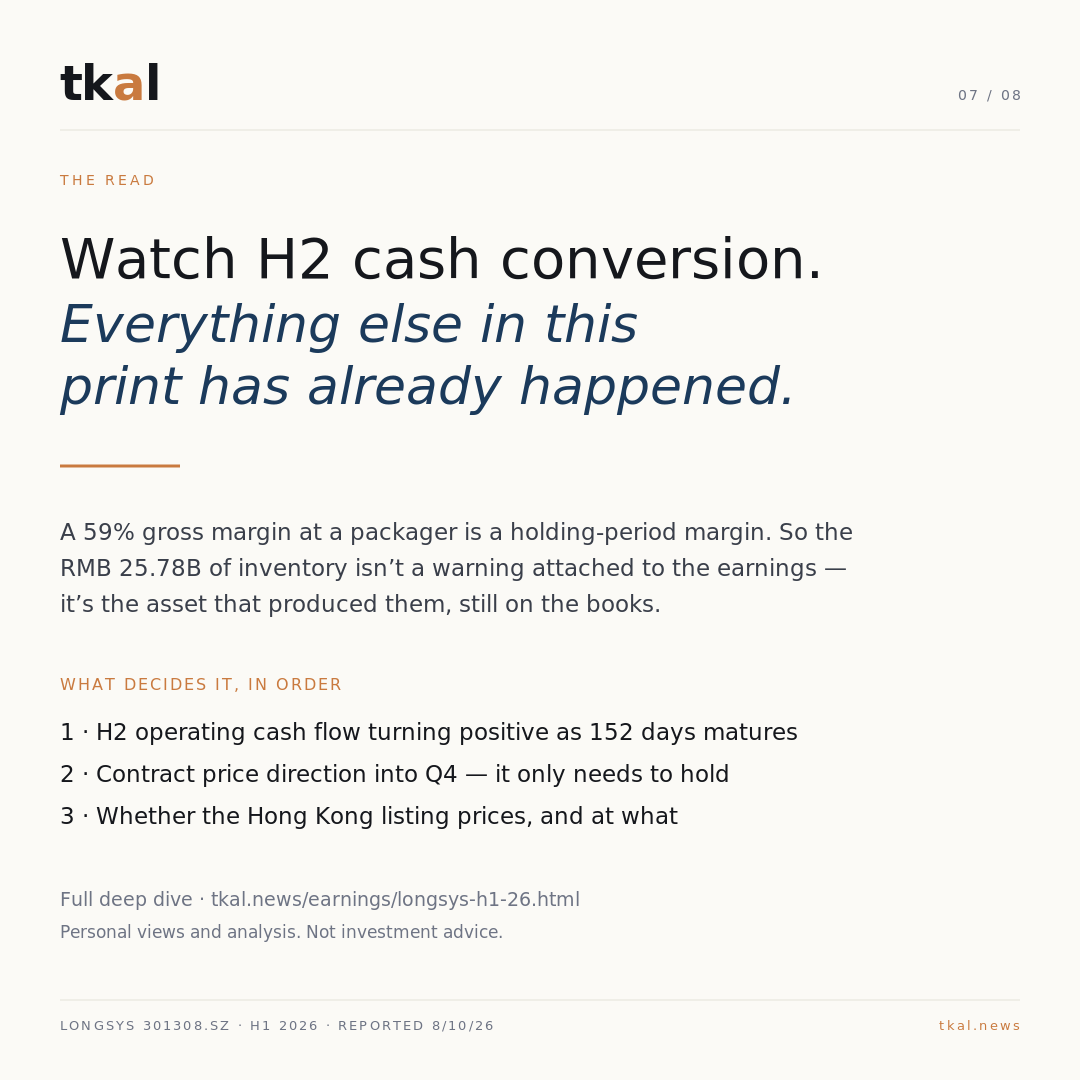
Longsys earned RMB 10.577B in six months on revenue of RMB 24.088B, a 59.08% storage gross margin, and a weighted ROE of 79.03%. The Chinese-language coverage has converged on one framing: enormous profit, alarming inventory, negative cash. Here is the claim I will defend instead. Those are one fact stated twice. A 59% gross margin at a company that owns no fab is a holding-period margin, not a manufacturing margin — the spread between what Longsys paid for wafers and what the finished goods now clear at. Which means the RMB 25.777B of inventory sitting at 60.12% of total assets isn't a warning label attached to the earnings; it is the asset that produced the earnings, still on the books. The warehouse is the position. So the number that settles this print is not revenue, not margin, and not the inventory balance — it is cash conversion. And the line nobody printed is the one that already moved: back out the disclosed Q1 figure and Q2 operating cash flow was roughly −RMB 276M, against −RMB 2.875B in Q1. The bleed didn't accelerate into the stockpile. It nearly stopped.
Published · Post-print synthesis (H1 2026 semi-annual report, period ended , released after close ) · 301308.SZ · Committed analyst read — not advice · For analysts covering memory, NAND/DRAM modules, storage controllers, and the China semiconductor supply chain

The only tension that matters

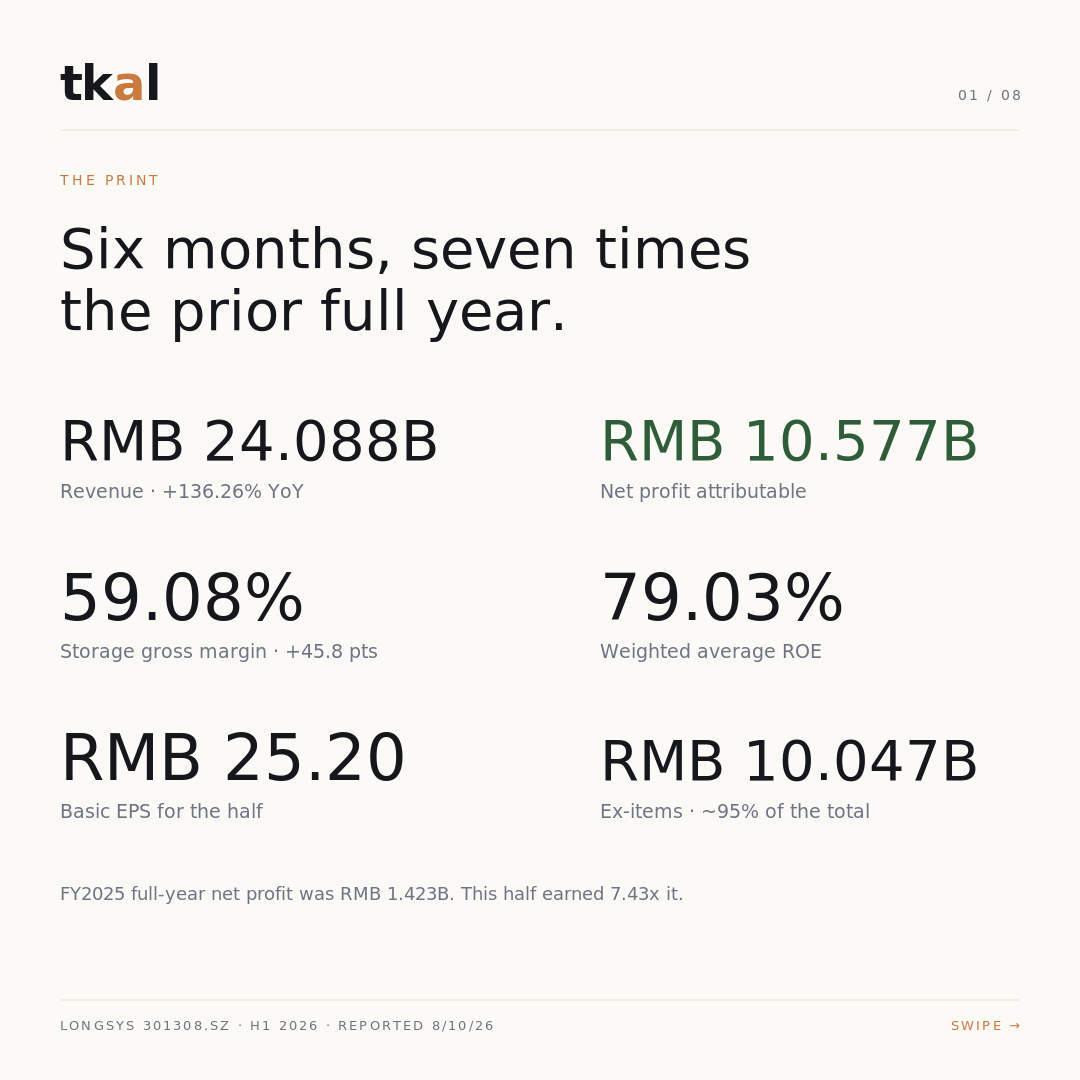
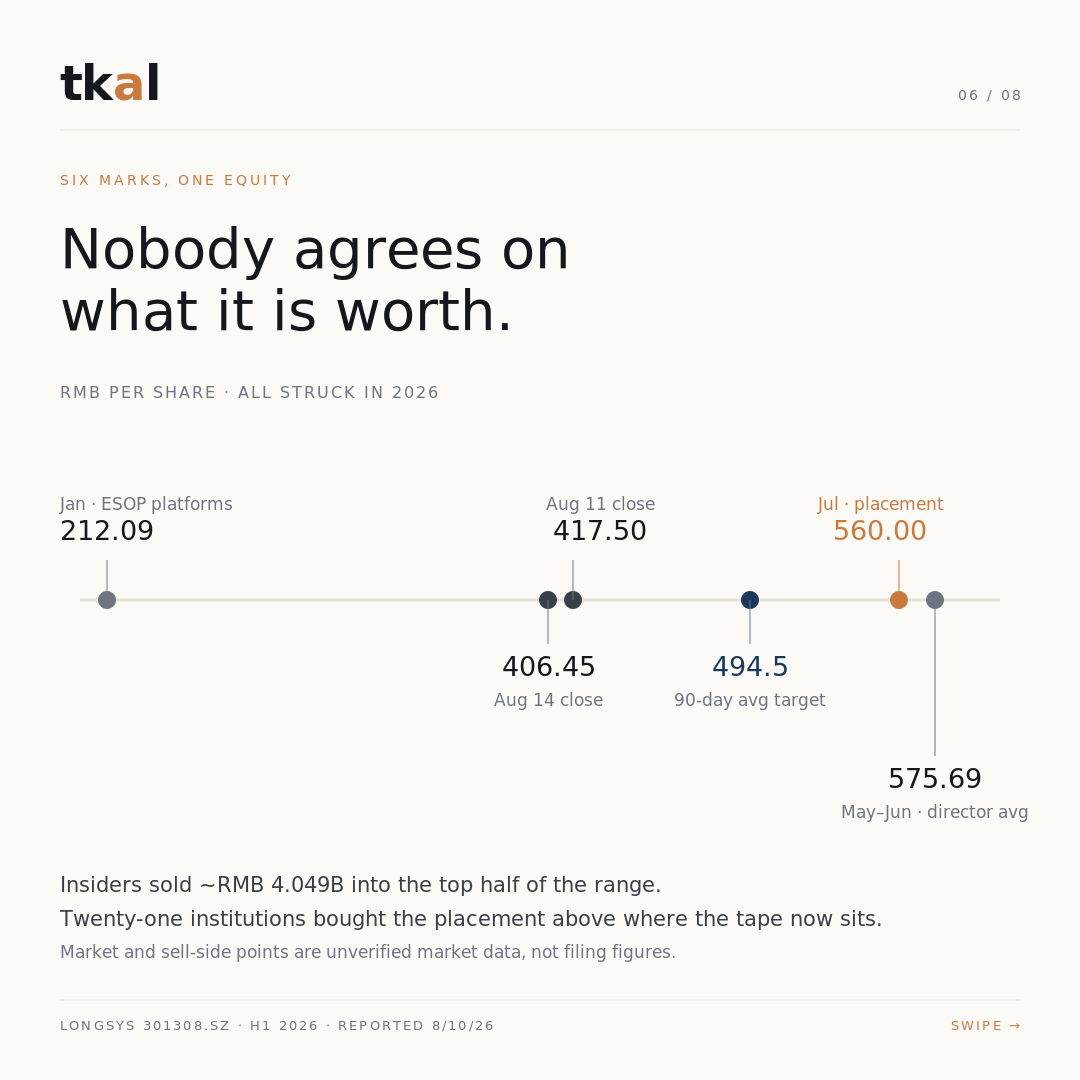
Longsys is not a fab. It buys DRAM and NAND wafers from the upstream giants, packages and controls them, and sells finished product under Lexar, Zhitai, and an enterprise and embedded line. I said in the Q1 write-up that this model is the story of the print, and the half-year report makes it undeniable. Revenue of RMB 24.088B (~US$3.35B at ~7.18 CNY/USD, approximate) rose 136.26% against RMB 10.196B. Net profit attributable to shareholders was RMB 10.577B (~US$1.47B) versus RMB 14.77M a year earlier — the +71,528.66% that made every headline, and the least informative number in the document, because the denominator was effectively zero. The figure that actually carries weight is smaller and stranger: net profit ex-non-recurring items of RMB 10.047B, meaning roughly 95% of the bottom line came from operations rather than one-offs. Basic EPS was RMB 25.20. Weighted average ROE was 79.03%. Against FY2025's full-year net profit of RMB 1.423B, this half earned 7.43x the entire prior year.

And in the same six months, operating cash flow was −RMB 3.151B, against +RMB 693M a year ago. Cash paid for goods and services was RMB 24.469B while cash received from sales was RMB 23.352B. Inventory went from RMB 11.678B to RMB 25.777B. The standard reading of that pairing is that the profit is somehow less real than it looks. I think that reading is lazy, and it is exactly the kind of place where the house edge lives — the gap between the narrative and what the data supports. The profit is real and it was earned in cash terms by the previous purchase decision; what is unfinished is the conversion. Longsys did not report a quarter. It reported the mark-to-market on a position it is still carrying.

Longsys H1 2026 Income Statement H1 2026 · six months ended · PRC GAAP consolidated · RMB in millions Revenue RMB 24,088M +136.3% Y/Y RMB 24,088M +136.3% Y/Y Operating revenue eMMC, UFS, SSDs, DRAM modules and Lexar retail storage Gross profit RMB 14,189M 58.9% margin from 13.0% a year ago Cost of revenue (RMB 9,900M) 41.1% of revenue Operating profit RMB 11,795M 49.0% margin Operating expenses (RMB 2,393M) Net profit RMB 9,570M 39.7% margin Income tax (RMB 2,012M) 15.8% of total profit Credit impairment losses (RMB 4M) Asset impairment losses (RMB 127M) Investment losses (RMB 80M) Non-operating expenses (RMB 2M) R&D (RMB 851M) 3.5% of revenue Selling (RMB 611M) 2.5% of revenue Finance costs (RMB 438M) 1.8% of revenue General & administrative (RMB 436M) 1.8% of revenue Taxes & surcharges (RMB 57M) Source: Longsys 2026 interim report, consolidated statement of profit or loss · chart: tkal.news
Where Longsys's H1 2026 revenue yuan went: 58.9% survives cost of sales, 49.0% survives the other operating costs, 39.7% lands as profit before the gains booked below the operating line — on a gross margin that went to 58.9% from 13.0%. RMB 24,088M − RMB 9,900M = RMB 14,189M gross profit; less RMB 2,393M of the remaining costs the filing groups under total operating cost = RMB 11,795M. That is not the filing's operating-profit subtotal of RMB 12,731M, which is struck after impairments, other income, investment income and fair-value changes; the chart puts each of those below the operating line instead. Inflows there — RMB 448M other income, RMB 672M fair-value gains, RMB 27M gains on asset disposal, RMB 1M non-operating income — cannot be drawn against a flow, so the chart shows profit excluding them: RMB 11,795M − RMB 2,225M = RMB 9,570M; that plus RMB 1,147M = RMB 10,718M net profit, of which RMB 10,577M is attributable to owners of the parent and RMB 141M to minority interests. Finance costs of RMB 438M sit inside operating cost, as the filing groups them. Y/Y on revenue against RMB 10,196M in H1 2025. Six months ended .

Read the profit and the cash side by side

Three figures tell the whole structure of this half, and stringing them through a sentence is exactly the thing readers can't hold. The chart does it in one look.

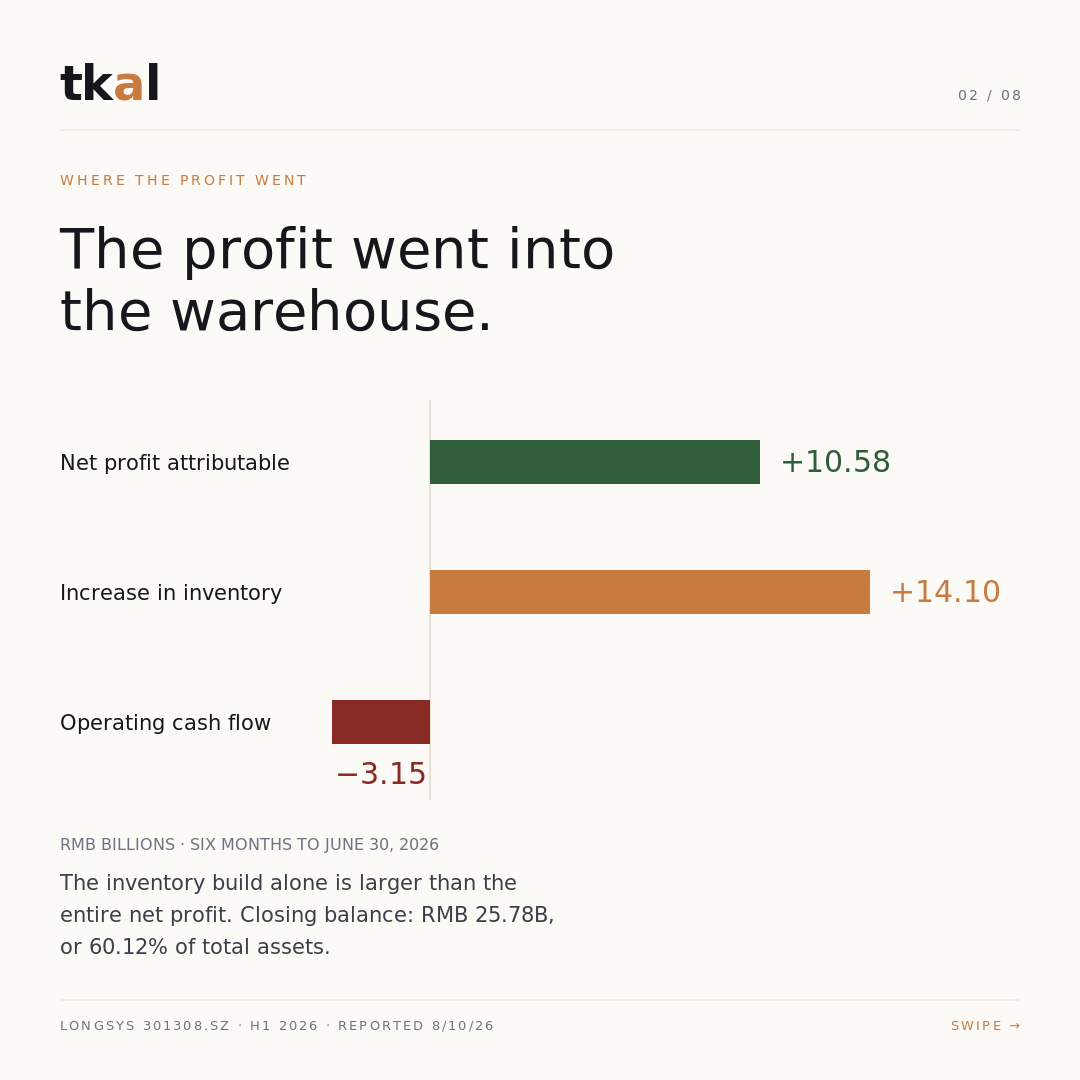
The profit went into the warehouse: Longsys H1 2026, RMB billions Six months to · bars scaled to the same axis · zero at the vertical rule Net profit attributable +10.58 Increase in inventory +14.10 Operating cash flow −3.15 Closing inventory balance 25.78 total · 60.12% of assets · axis truncated The inventory build alone is larger than the entire net profit. That is the sentence this print is really making.
H1 2026: net profit attributable RMB 10.577B, operating cash flow −RMB 3.151B, inventory RMB 25.777B at period end versus RMB 11.678B at . Derivation: the inventory increase of +RMB 14.099B is the difference of the two disclosed balances (25.777 − 11.678); it is shown next to profit and cash for scale, not as a cash-flow reconciliation — payables, depreciation, provisions and tax are not broken out here and the three bars do not sum to anything.

Now decode it. The company's own language for the inventory is "strategic stockpiling" (战略性备货), executed through long-term agreements and MOUs with upstream suppliers because, in its framing, AI demand has tilted wafer capacity toward enterprise parts and left commodity supply structurally short. Strip the corporate register and that is a plain statement of intent: we deliberately went long inventory ahead of a price move we expected. Inventory turnover fell from 1.8x to 1.2x and inventory days extended from 99 to 152. Read conventionally, slowing turns are a demand warning. Read against the stated strategy, 152 days is the holding period of the trade — you cannot simultaneously praise a company for locking supply ahead of a shortage and mark it down for holding what it locked.

Paid subscribers

The rest of this dive is for paid subscribers.

The headline numbers are above. The 9 sections below carry the mechanism, the peer read, the valuation work, and the dated tests that decide it.

  • A 59% gross margin at a company that owns no fab
  • The line nobody printed
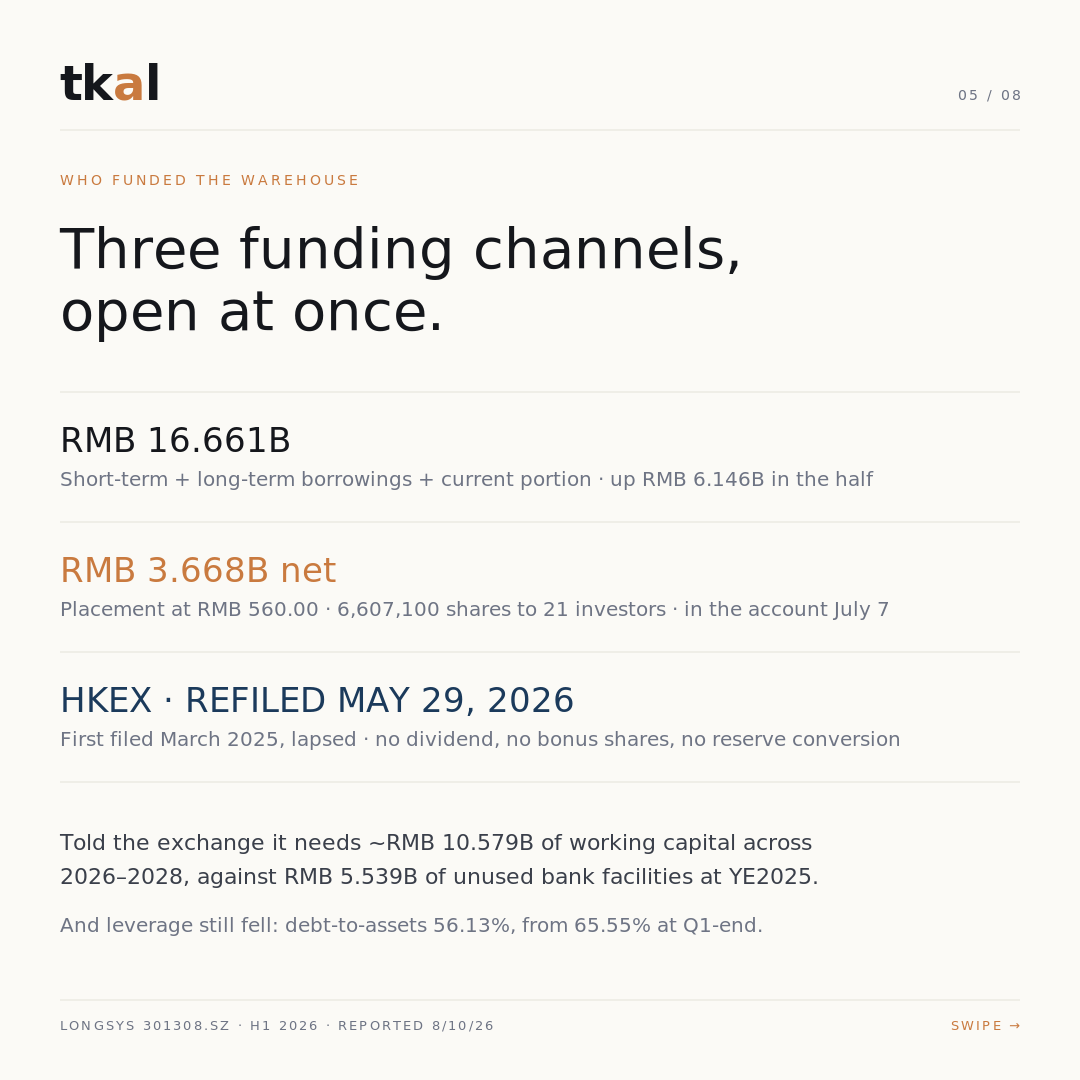
  • Who funded the warehouse
  • The strongest case against me
  • How the rest of the stack reads it
  • Valuation: paying for a holding-period margin
  • What decides it from here
  • The trade (analysis, not advice)
  • Bottom line
Subscribe to unlock →

Already a subscriber? Sign in.

Subscribe · free weekly

This is one print. The pipeline runs every week.

Every Monday, the single sharpest call from the pipeline — a dated, falsifiable read on credit, demand, and capex, then graded in public on the scorecard. Free.

One email to confirm. Unsubscribe any time.

Sources