
The setup
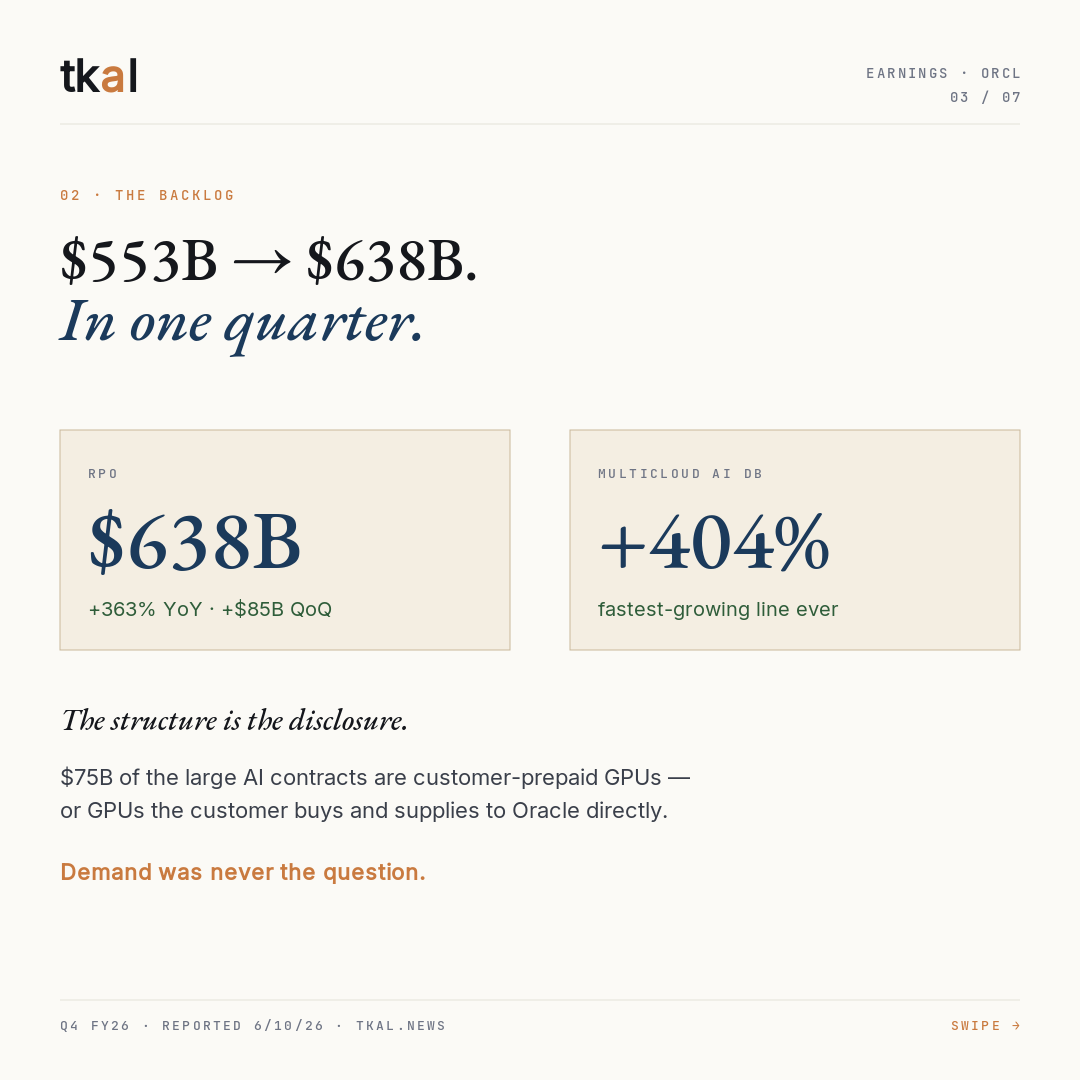
Oracle printed Q4 FY26 (quarter ended ) after the close on , into a tape that had already turned skeptical — the stock had drifted below $200 in the sessions before the report and closed the day at $203.47, down about 1%. The question coming in was never demand. The $553B RPO number from Q3 had settled that. The question was conversion and cost: how fast does a half-trillion-dollar backlog become revenue, and what does it cost to build the datacenters that serve it?
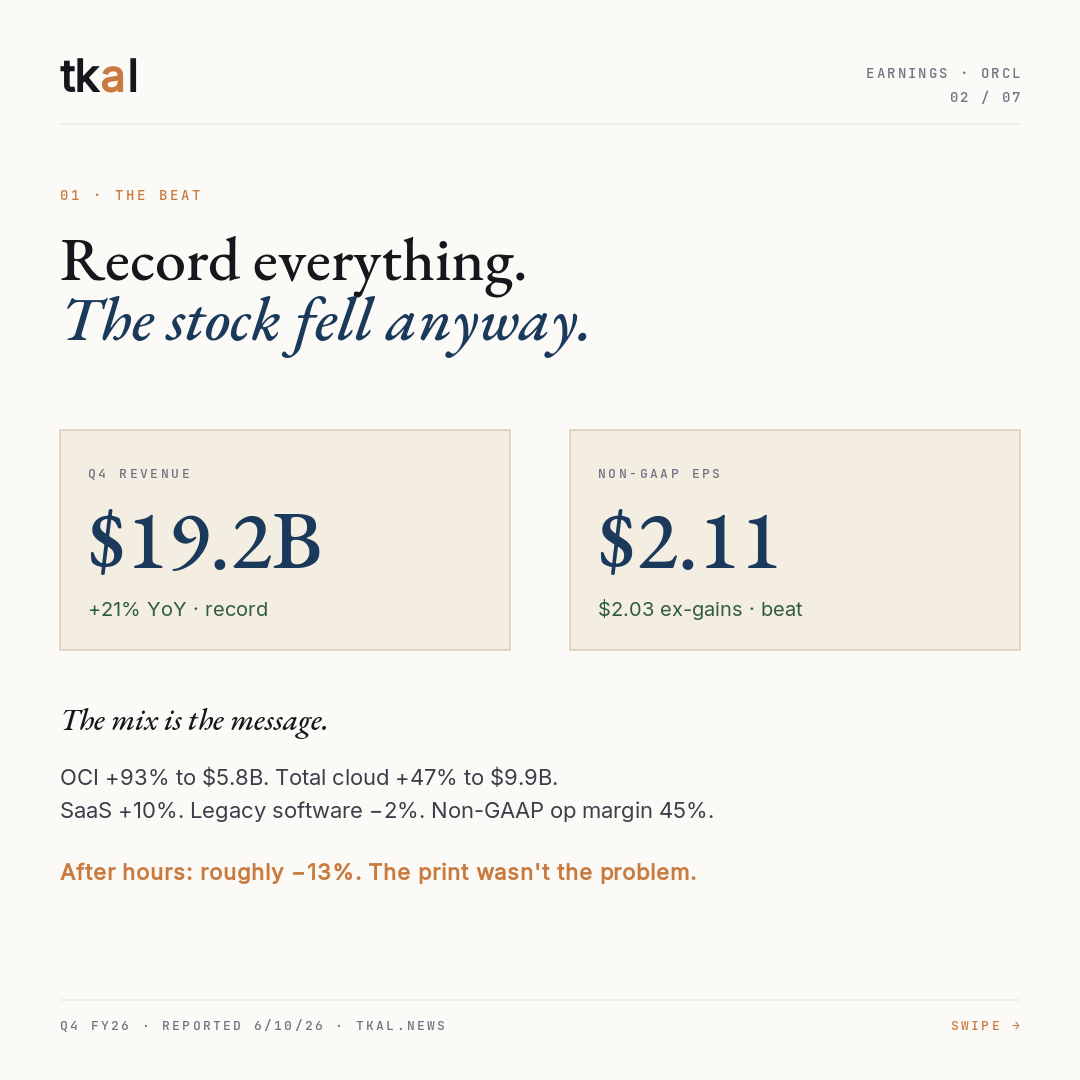
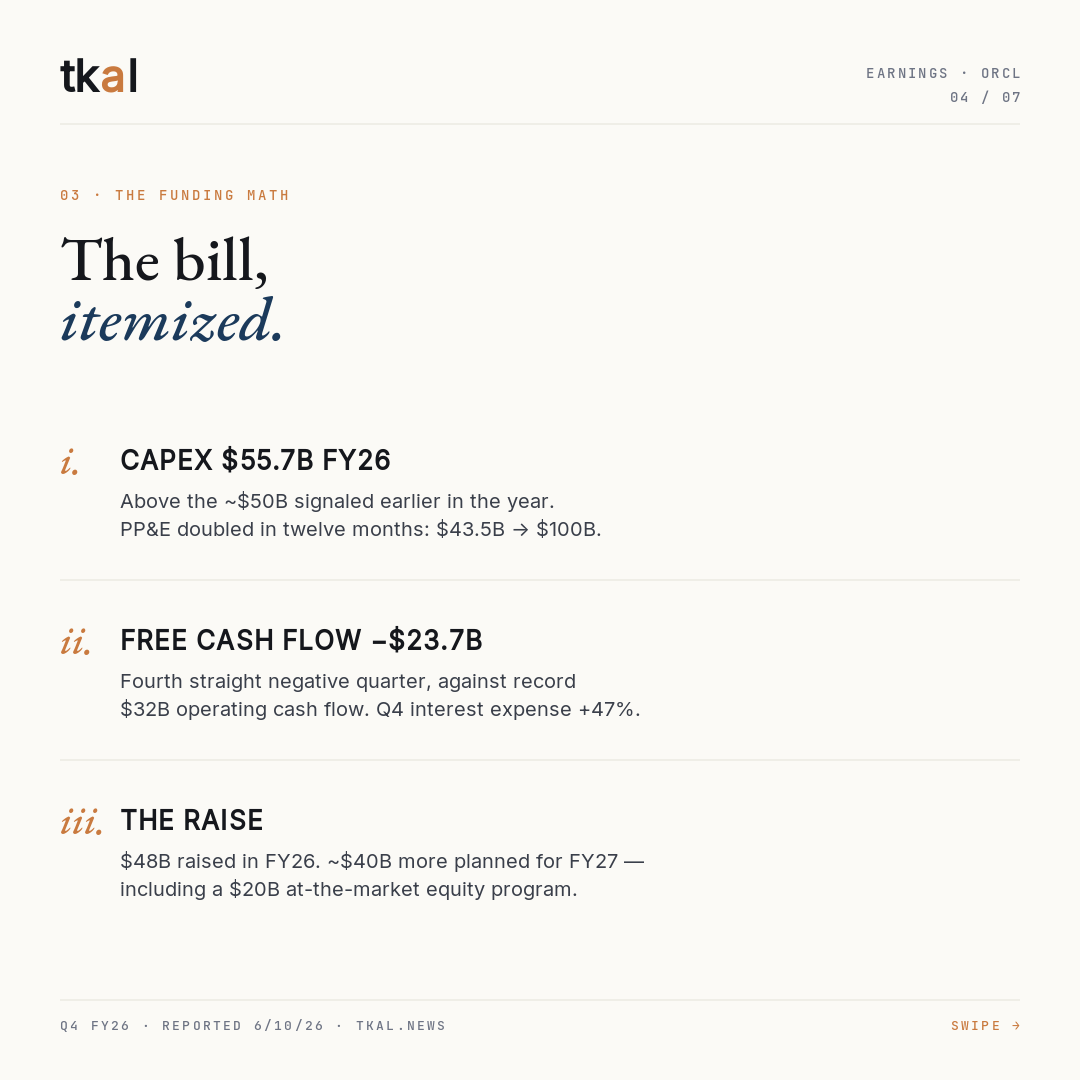
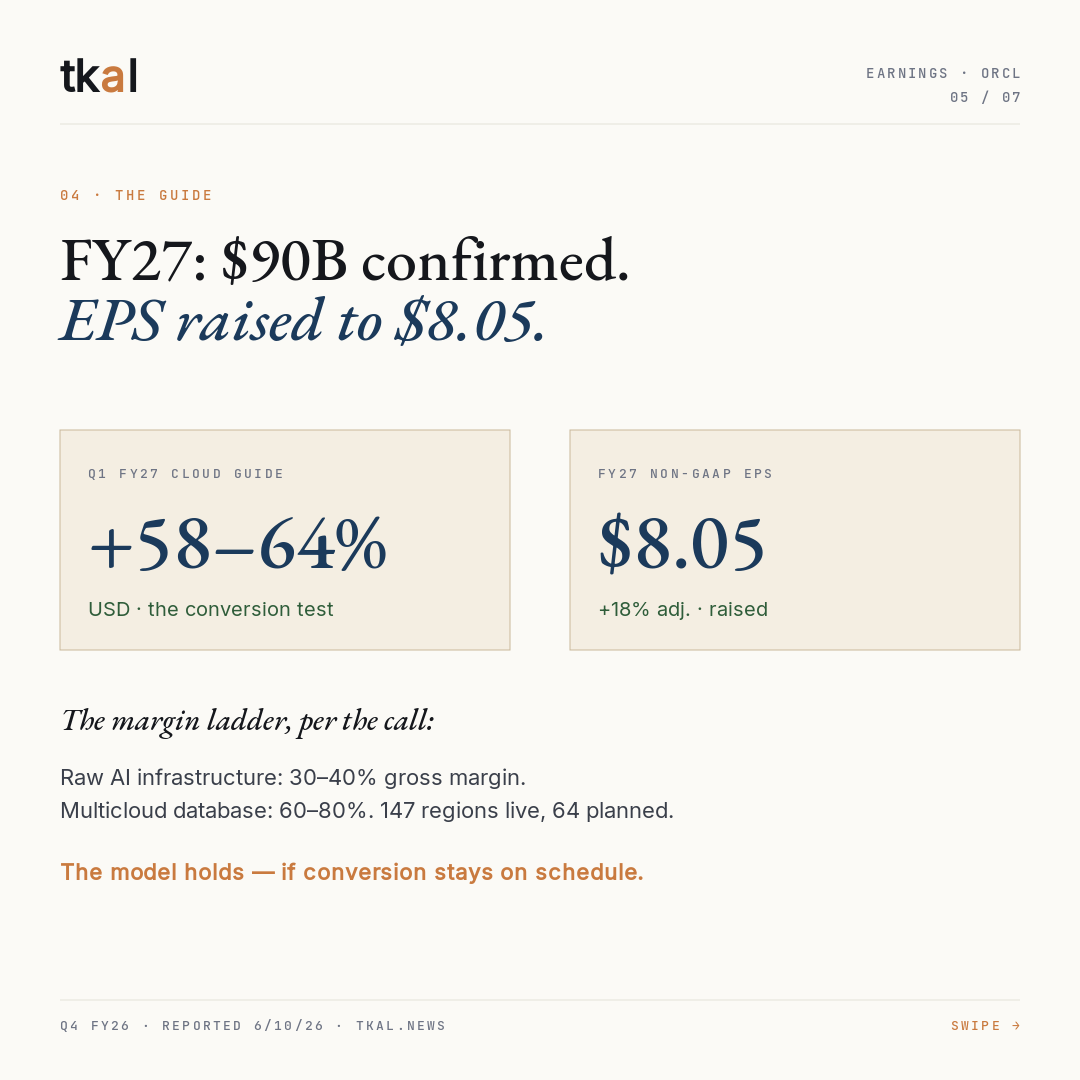
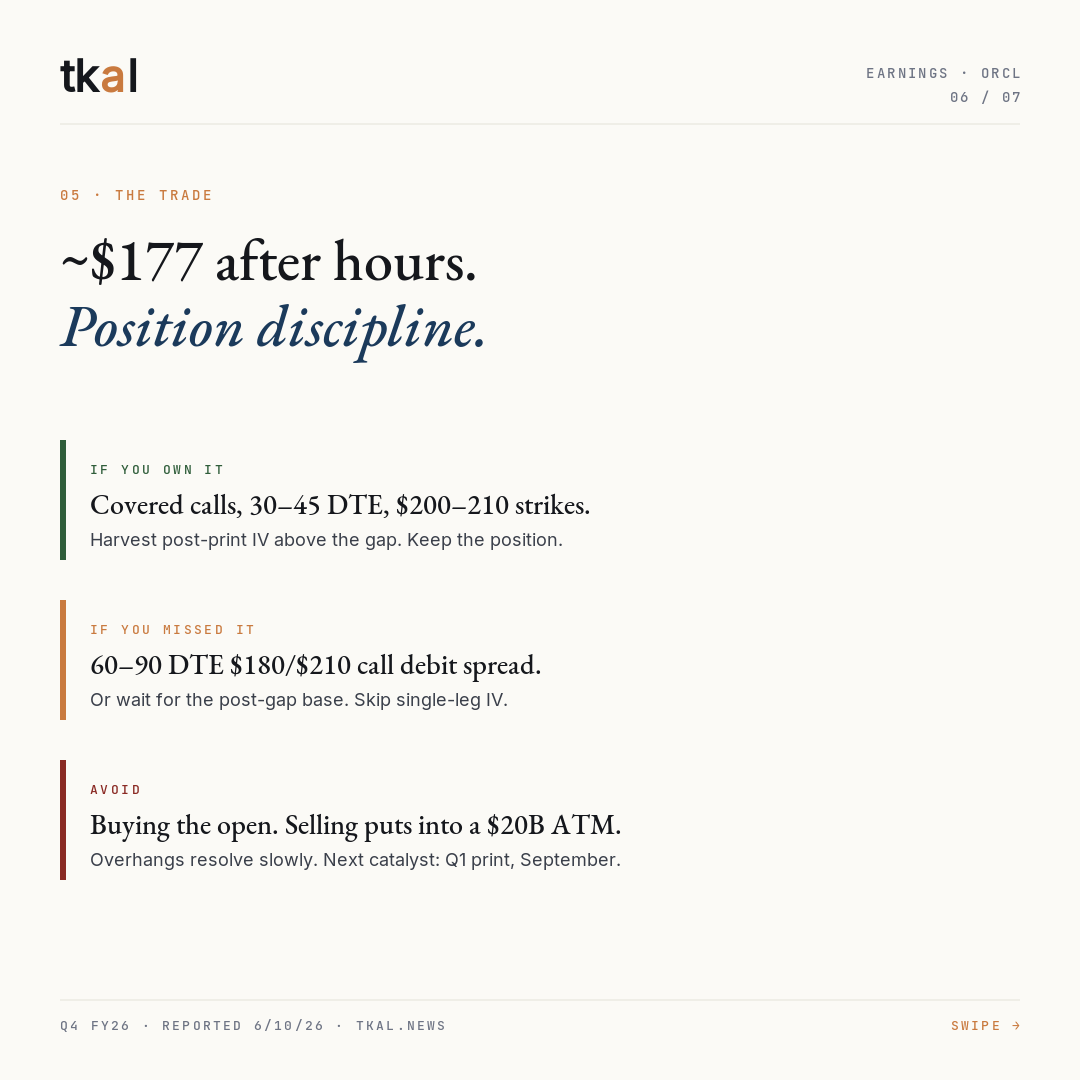
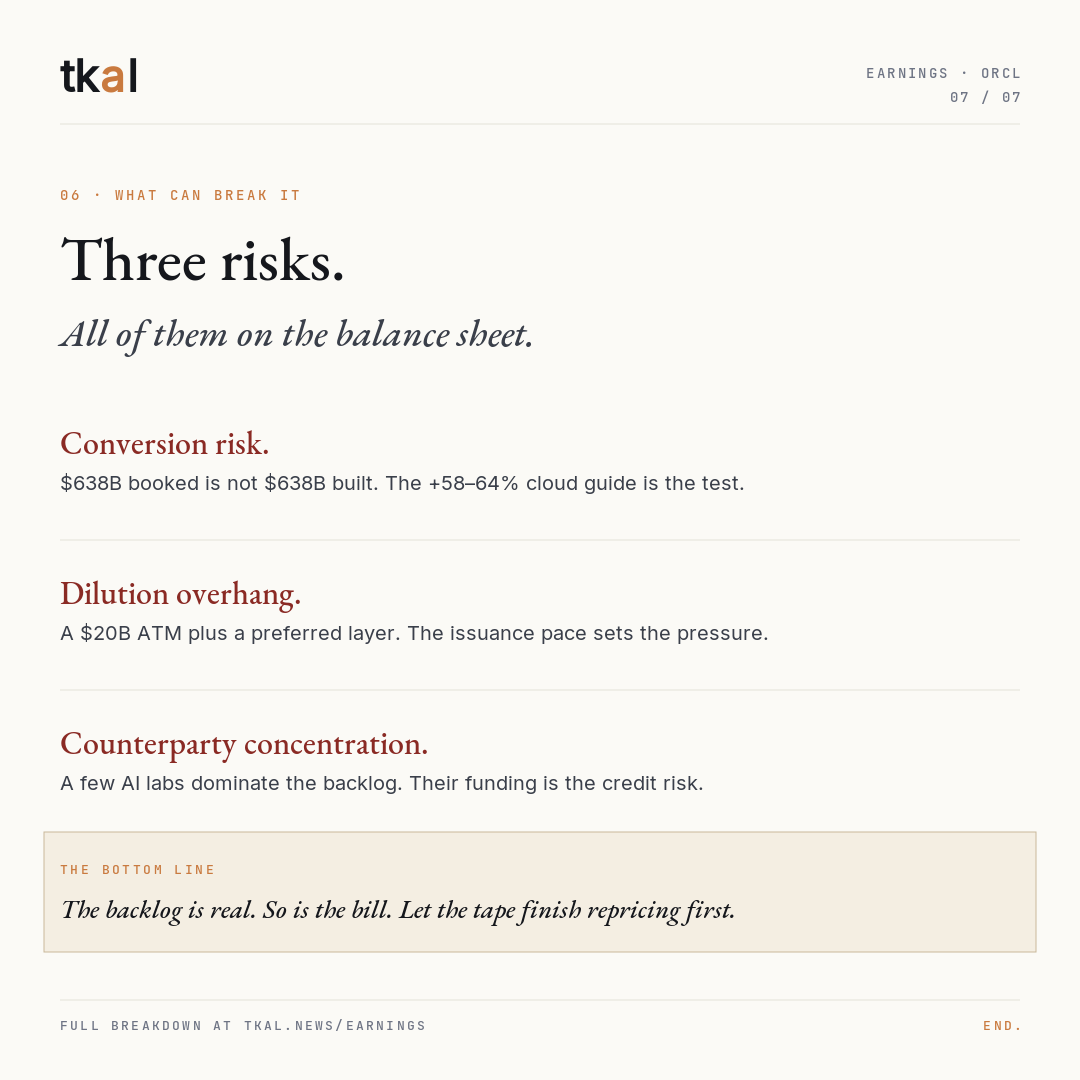
The print answered the first question emphatically and the second one uncomfortably. RPO grew another $85 billion in the quarter, to $638 billion, and Cloud Infrastructure revenue grew 93%. But fiscal-year capex landed at $55.7 billion — above the roughly $50B the company had signaled earlier in the year (unverified on the prior guide figure; widely reported) — free cash flow stayed deeply negative for a fourth straight quarter, and the FY27 funding plan calls for another ~$40 billion, including the previously announced $20 billion at-the-market equity issuance. The stock fell roughly 13% in the after-hours session, trading near $177.50 as of 7:19pm ET (Robinhood real-time quote; unverified as a settled close — the number that matters is tomorrow's). A record print, sold hard.
The numbers
Q4 total revenue was $19,184M, +21% year-over-year (+20% constant currency) — a record, and ahead of the ~$19.1B consensus (unverified consensus figure). The mix is the story it has been all year: total cloud $9,913M (+47%), inside which Cloud Infrastructure (IaaS) was $5,787M, +93% — accelerating from +84% in Q3, +68% in Q2, +55% in Q1 — and Cloud Applications (SaaS) was $4,126M, +10%. Legacy software declined 2% to $6,824M as on-premise migrates to cloud. OCI is now the company's largest and fastest line at once: a 93% grower that is 58% of total cloud revenue.
Profitability held its shape through the buildout. GAAP operating income was $6,133M (+20%, 32% margin); non-GAAP operating income a record $8,590M (+22%, 45% margin) — helped by "operating efficiency actions taken during the quarter," which is the polite rendering of an $823M restructuring charge, up from $83M a year ago. Non-GAAP EPS was $2.11, +24%; GAAP EPS $1.45, +21%. One footnote deserves its own sentence: Q4 results include one-time net investment gains (the Ampere chip business sale and Bloom Energy warrants among them), and ex-gains, Q4 non-GAAP EPS was $2.03 and FY26 non-GAAP EPS was $6.83, not $7.63. Against a ~$1.89 Street number (unverified), the operating beat is real but materially smaller than the headline.
The full year: revenue $67,357M, +17%; cloud $33,989M, +39%; operating cash flow a record $31,977M, +54%; capital expenditures $55,663M; free cash flow negative $23,686M. The balance sheet now carries the buildout's footprint: PP&E more than doubled in twelve months, from $43.5B to $100.0B; total borrowings stand at roughly $129.5B against $31.3B of cash; Q4 interest expense was $1,438M, +47% year-over-year. A mandatory convertible preferred raised ~$5.0B during the year and now collects dividends ahead of common shareholders — a small line ($81M in Q4) that didn't exist a year ago.
The rest of this dive is for paid subscribers.
The headline numbers are above. The 7 sections below carry the mechanism, the peer read, the valuation work, and the dated tests that decide it.
- What's actually driving it
- The guide
- How peers read this
- Valuation reality check
- What we'd watch from here
- Listed-market read-through
- Bottom line
Already a subscriber? Sign in.