

The setup
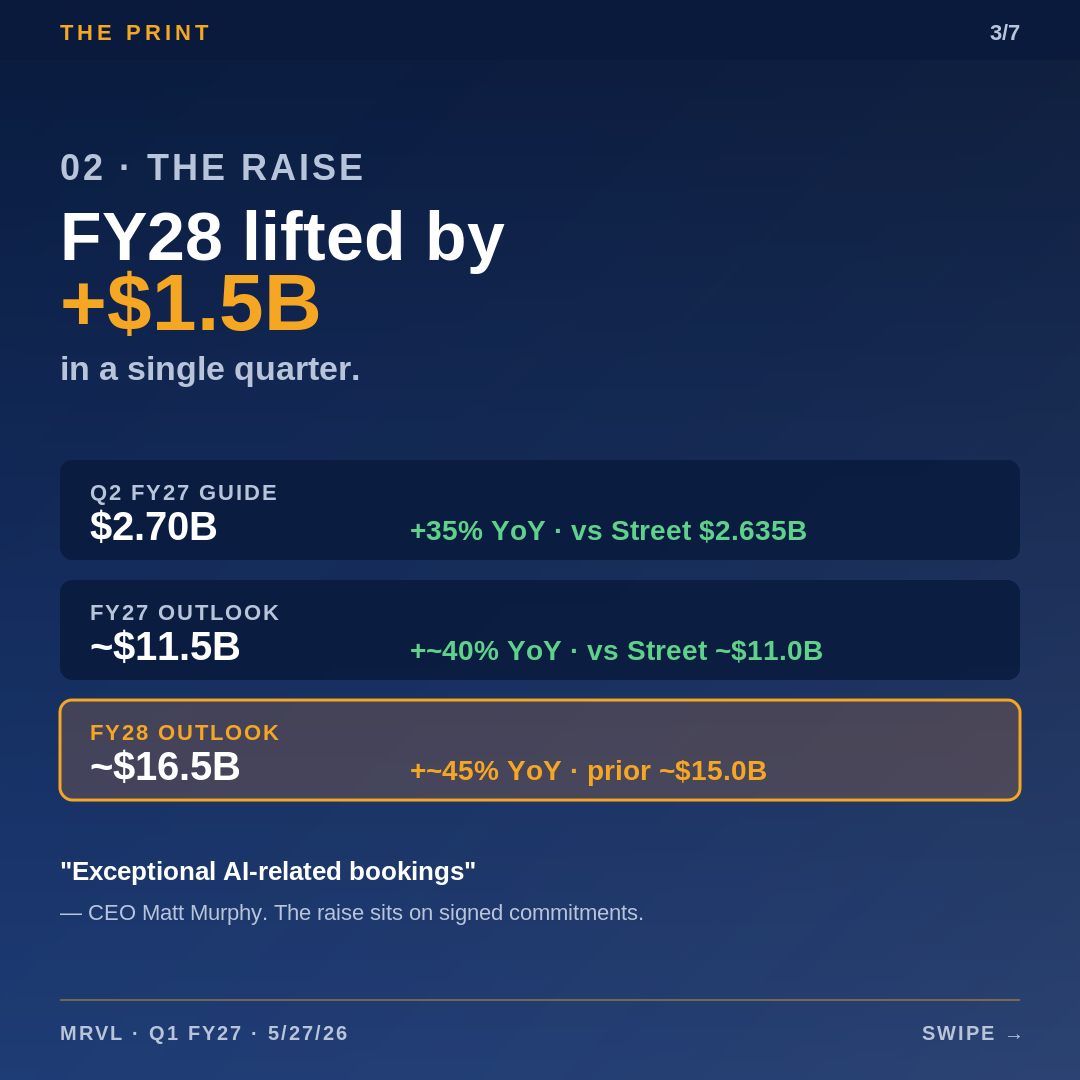
Marvell printed Q1 FY27 on AMC and did the one thing the bears couldn't recover from: it raised FY28 by ~$1.5B in a single quarter. That's not a tape-bomb; it's a structural re-rating signal. The Street walked in modeling MRVL as the smaller, slower cousin of AVGO. It walked out re-modeling MRVL as a credible custom-silicon platform with hyperscaler conviction extending two years out.
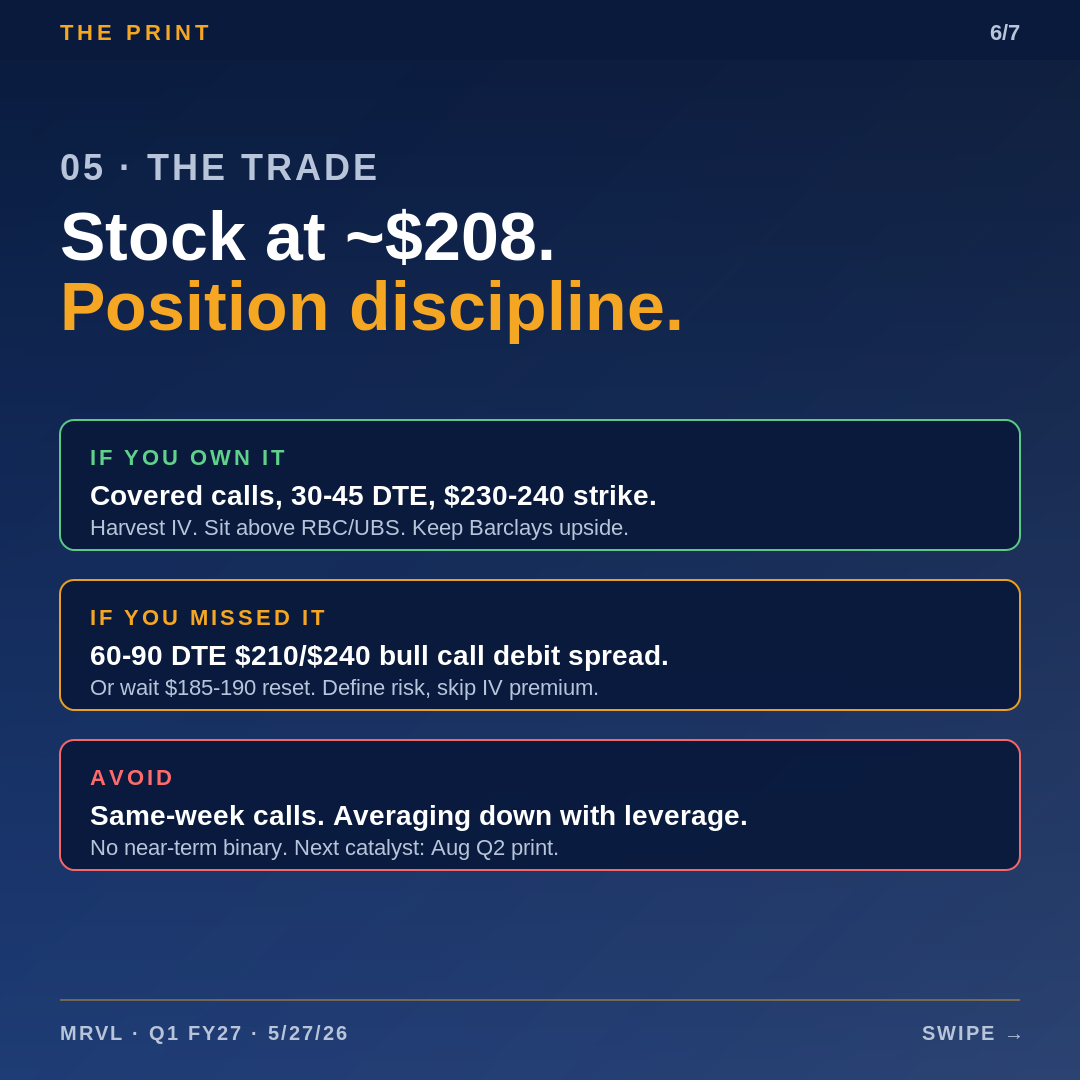
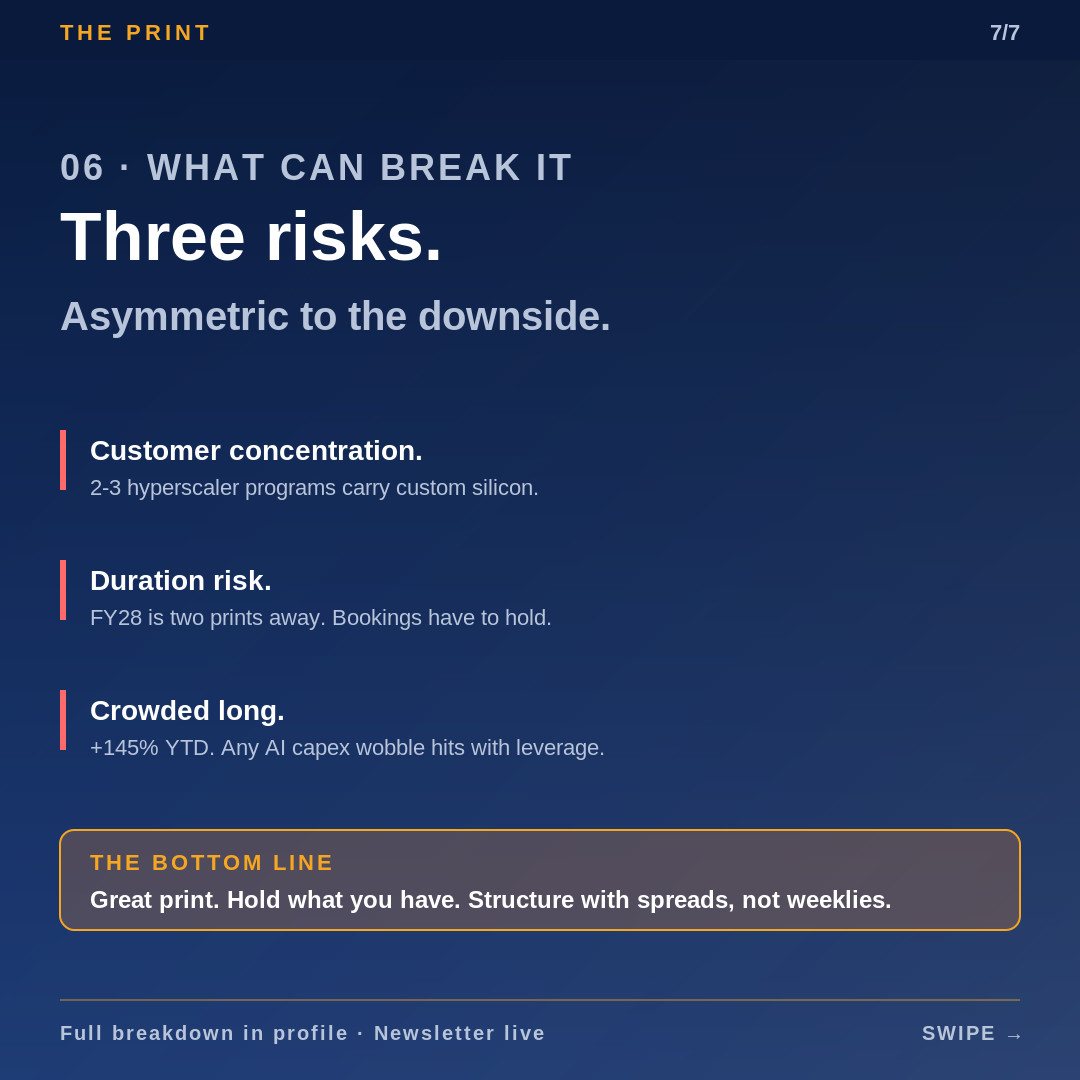
The shares responded the way shares respond when a crowded long meets a clean print: +5% AH to $218.81, then a partial give-back into Thursday's $208 close. The setup from here is no longer about the print. It's about what the next two quarters of bookings do to consensus FY28.
The numbers
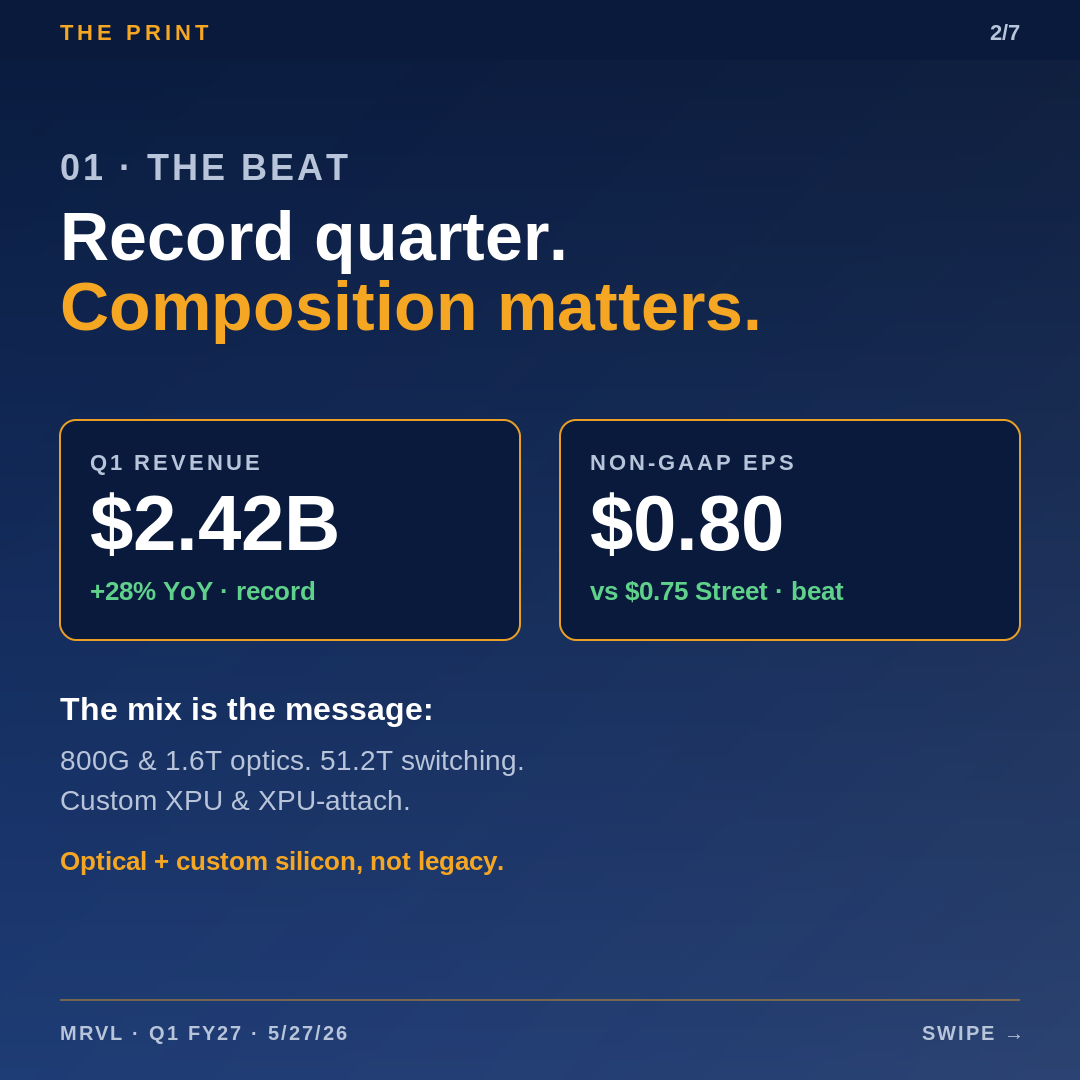
Revenue $2.418B (+28% YoY), $18M above the mid-point of management's March guide and a hair light of the $2.449B Street whisper. Non-GAAP EPS $0.80 vs $0.75 consensus. Data center continues to absorb the mix shift — explicit call-outs on 800G and 1.6T scale-out optics, 51.2T Ethernet switches, scale-up optical, DCI modules, and custom XPU / XPU-attach. The composition of the beat matters more than the magnitude: this is an optical and custom-silicon quarter, not a recovery-in-enterprise-networking quarter.
Q2 guide: $2.70B ±5%, midpoint +35% YoY, ~2.5% above the $2.635B Street. FY27 raised to ~$11.5B (+~40% YoY) vs Street ~$11.0B. FY28 raised to ~$16.5B (+~45% YoY) from a prior framing in the ~$15B range. CEO Matt Murphy's language — "exceptional AI-related bookings" — is doing real work in that FY28 raise. He's not guiding off model optimism; he's guiding off signed customer commitments. That's the distinction the buy-side will reward.
The rest of this dive is for paid subscribers.
The headline numbers are above. The 6 sections below carry the mechanism, the peer read, the valuation work, and the dated tests that decide it.
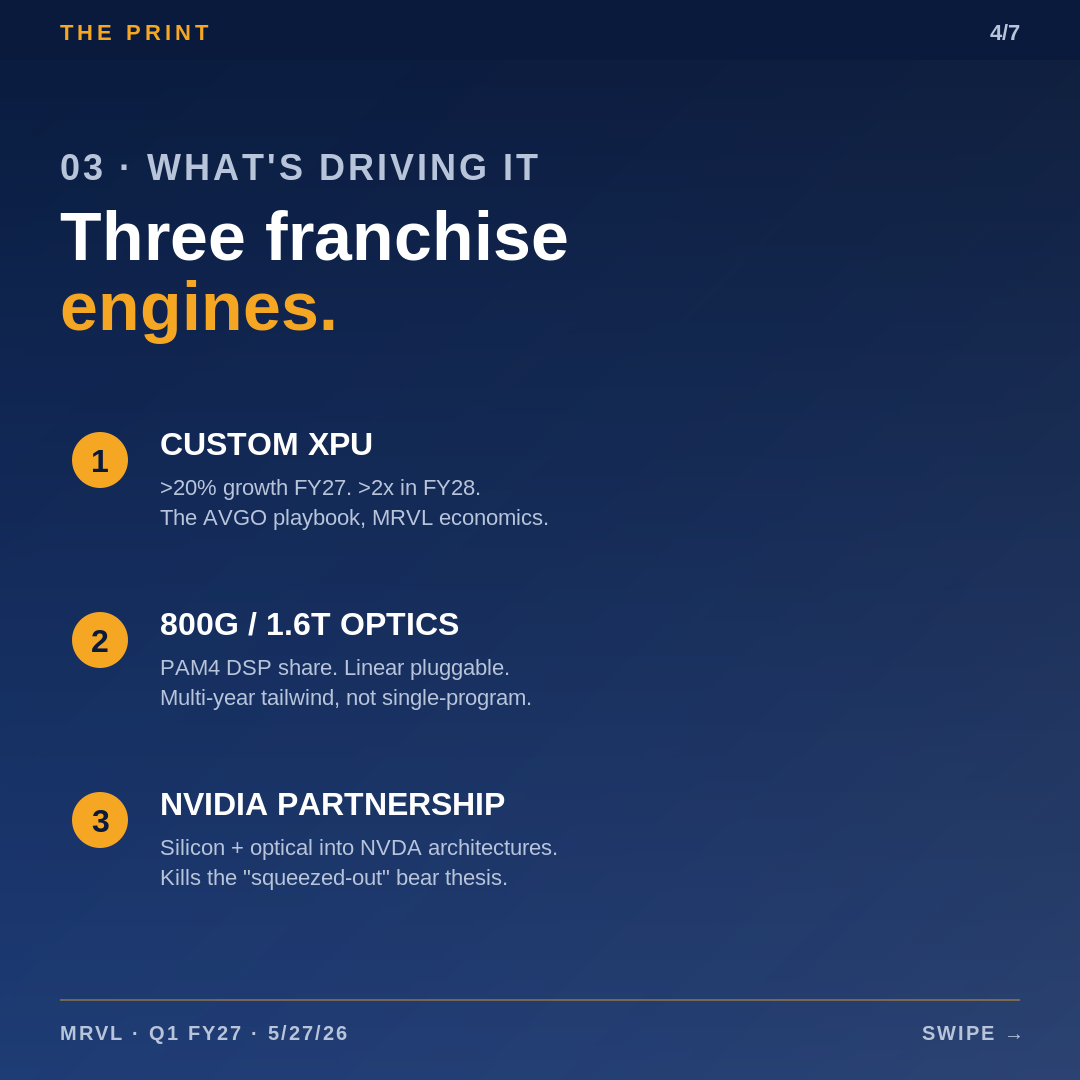
- What's actually driving the re-rate
- How peers read this
- Valuation reality check
- What we'd watch from here
- Listed-market read-through
- Bottom line
Already a subscriber? Sign in.