
The setup
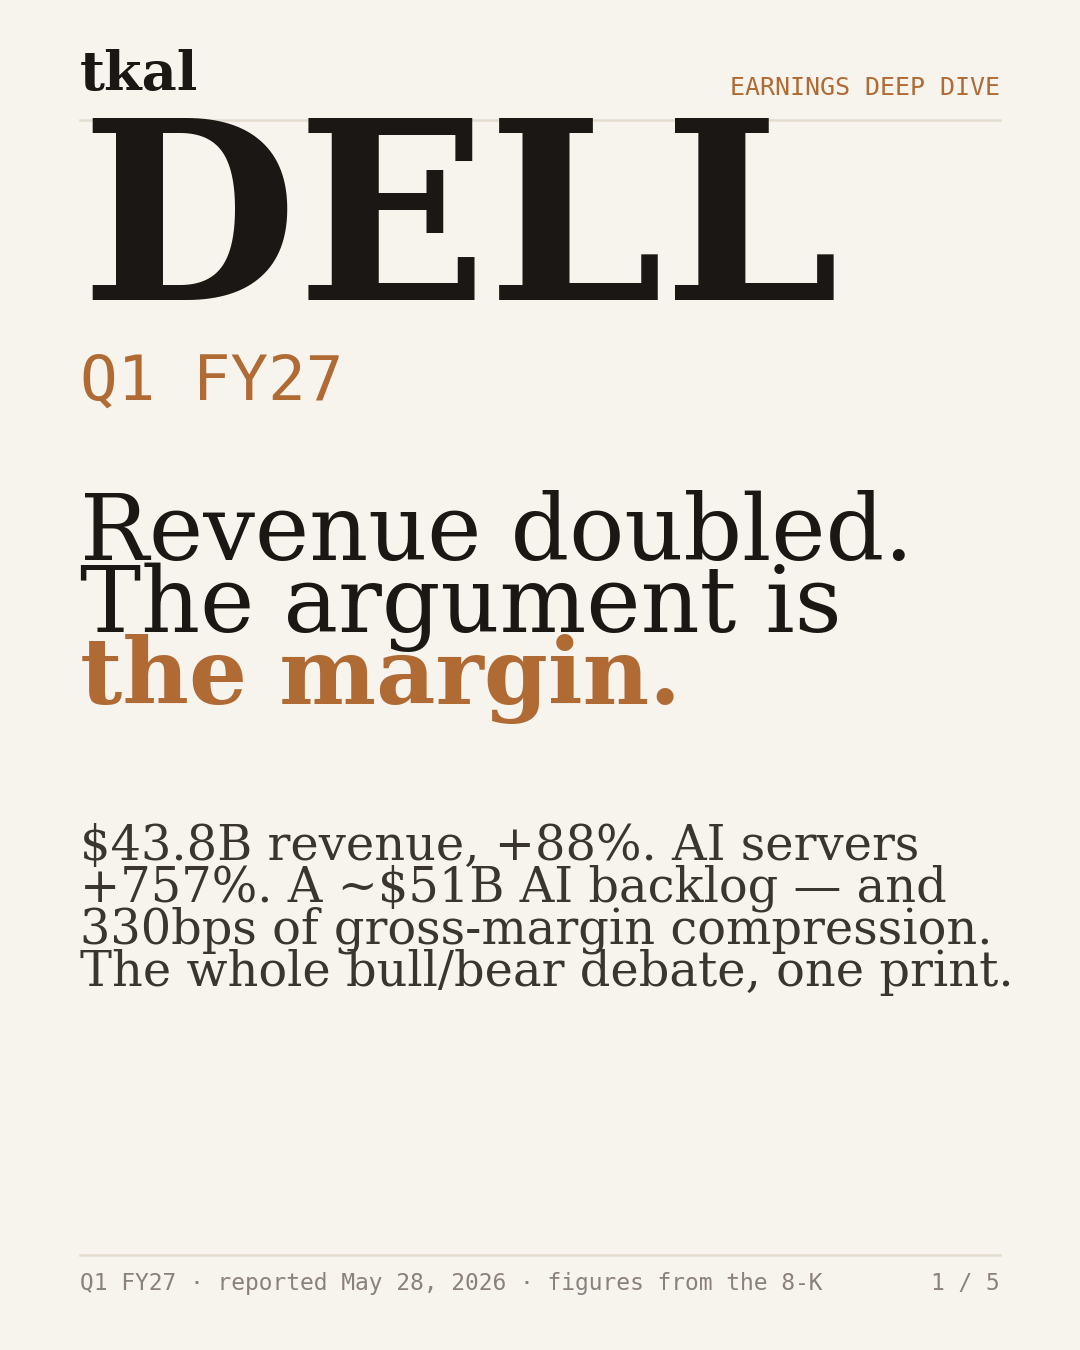
Dell came into this print as the consensus "cheapest way to own the AI buildout" — a systems OEM trading at a hardware multiple while routing an exploding share of hyperscaler and neocloud GPU spend through its books. The bull case was always volume: Dell's scale, supply chain, and financing arm let it win Blackwell-class rack deals that smaller integrators can't underwrite. The bear case was always the flip side of that same coin — that AI-server revenue is largely GPU pass-through, structurally thin, and dilutive to the corporate margin Dell spent a decade rebuilding. Q1 FY27 is the quarter where both sides got their evidence on the same page.
The numbers
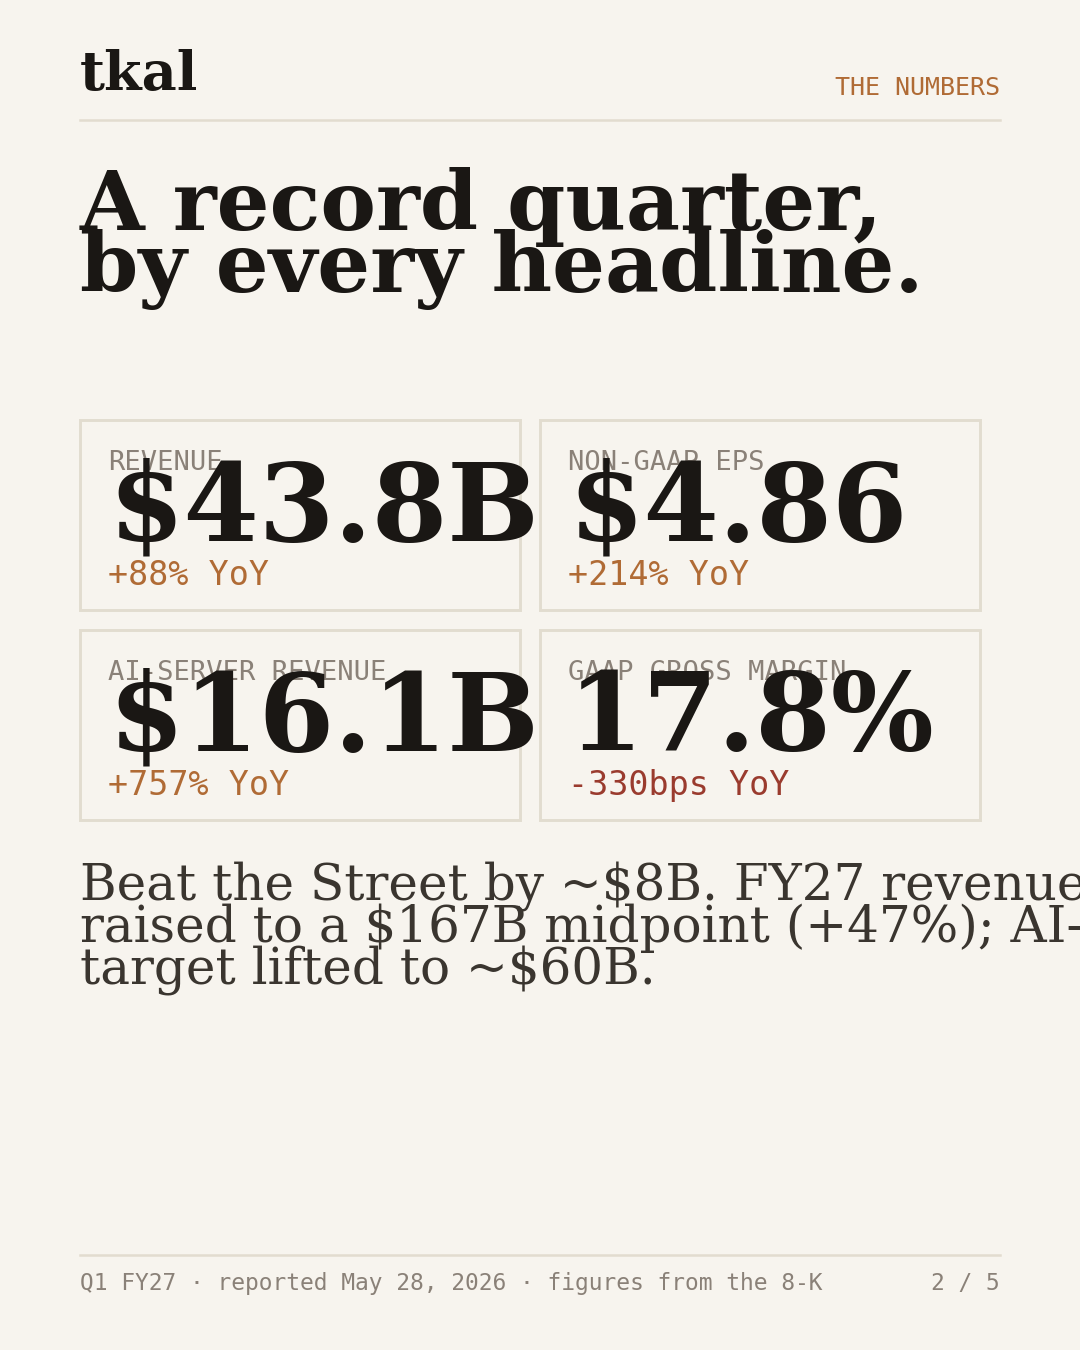
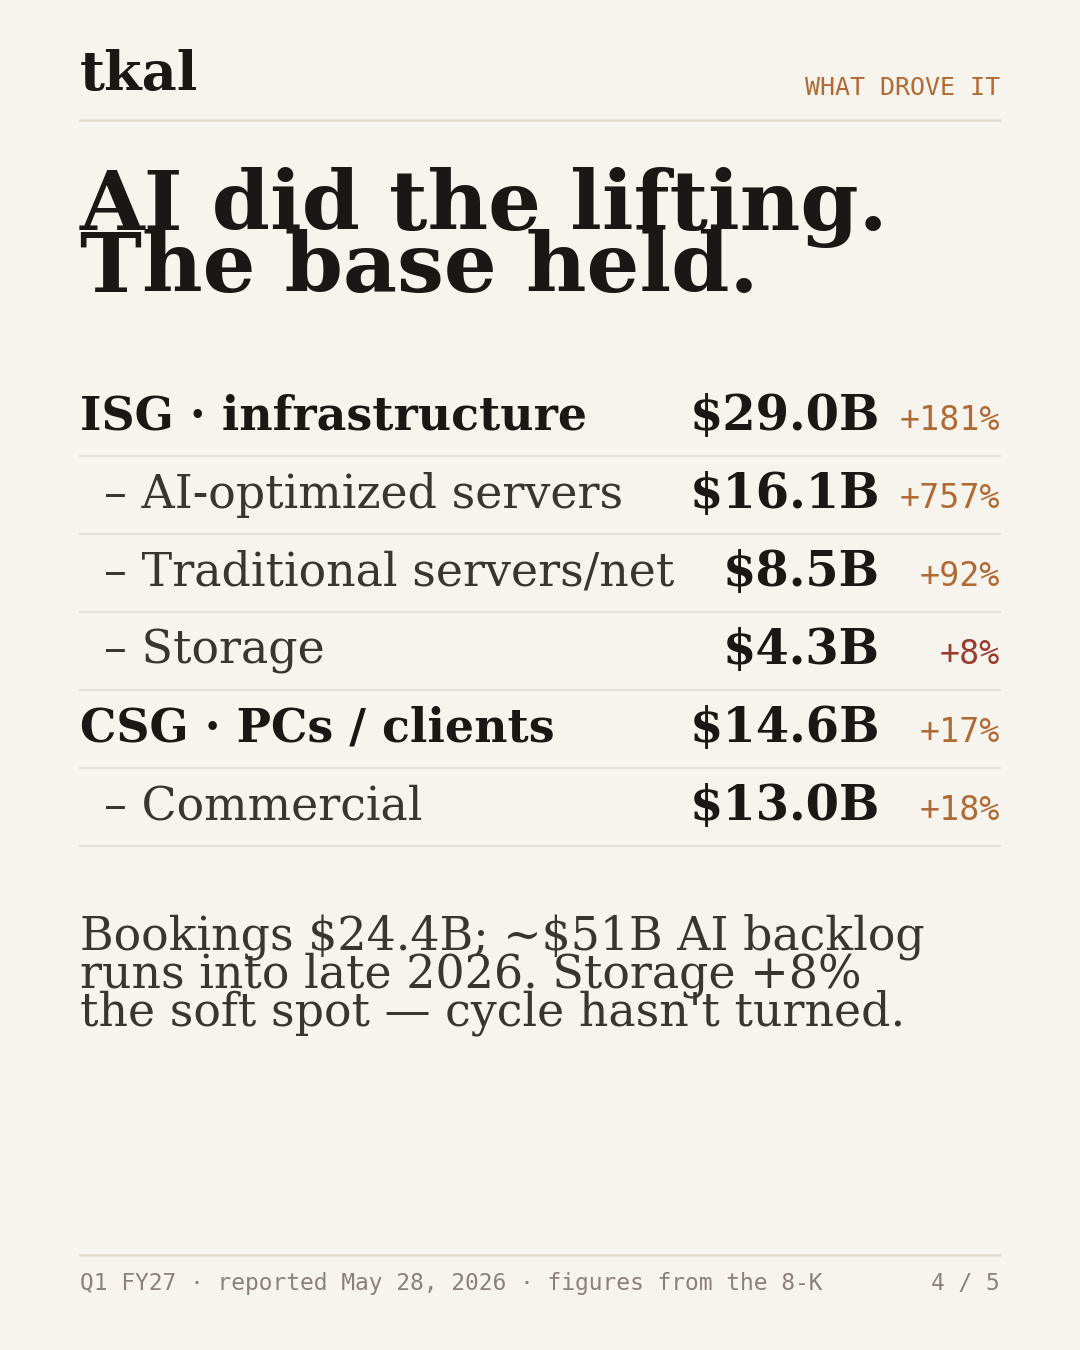
Revenue of $43.8B was up 88% year over year and beat the Street by roughly $8B — one of the largest top-line surprises a company this size has printed. GAAP diluted EPS was $5.24 (+282%); non-GAAP diluted EPS was $4.86 (+214%). Operating cash flow was a record Q1 $4.1B; adjusted free cash flow $3.2B; capital returns $2.1B. Management raised the full-year FY27 revenue outlook to a $167B midpoint (+47%) and lifted the AI-server revenue target to roughly $60B (+144%). Q2 is guided to $44.0–45.0B with non-GAAP EPS of $4.80 at the midpoint.
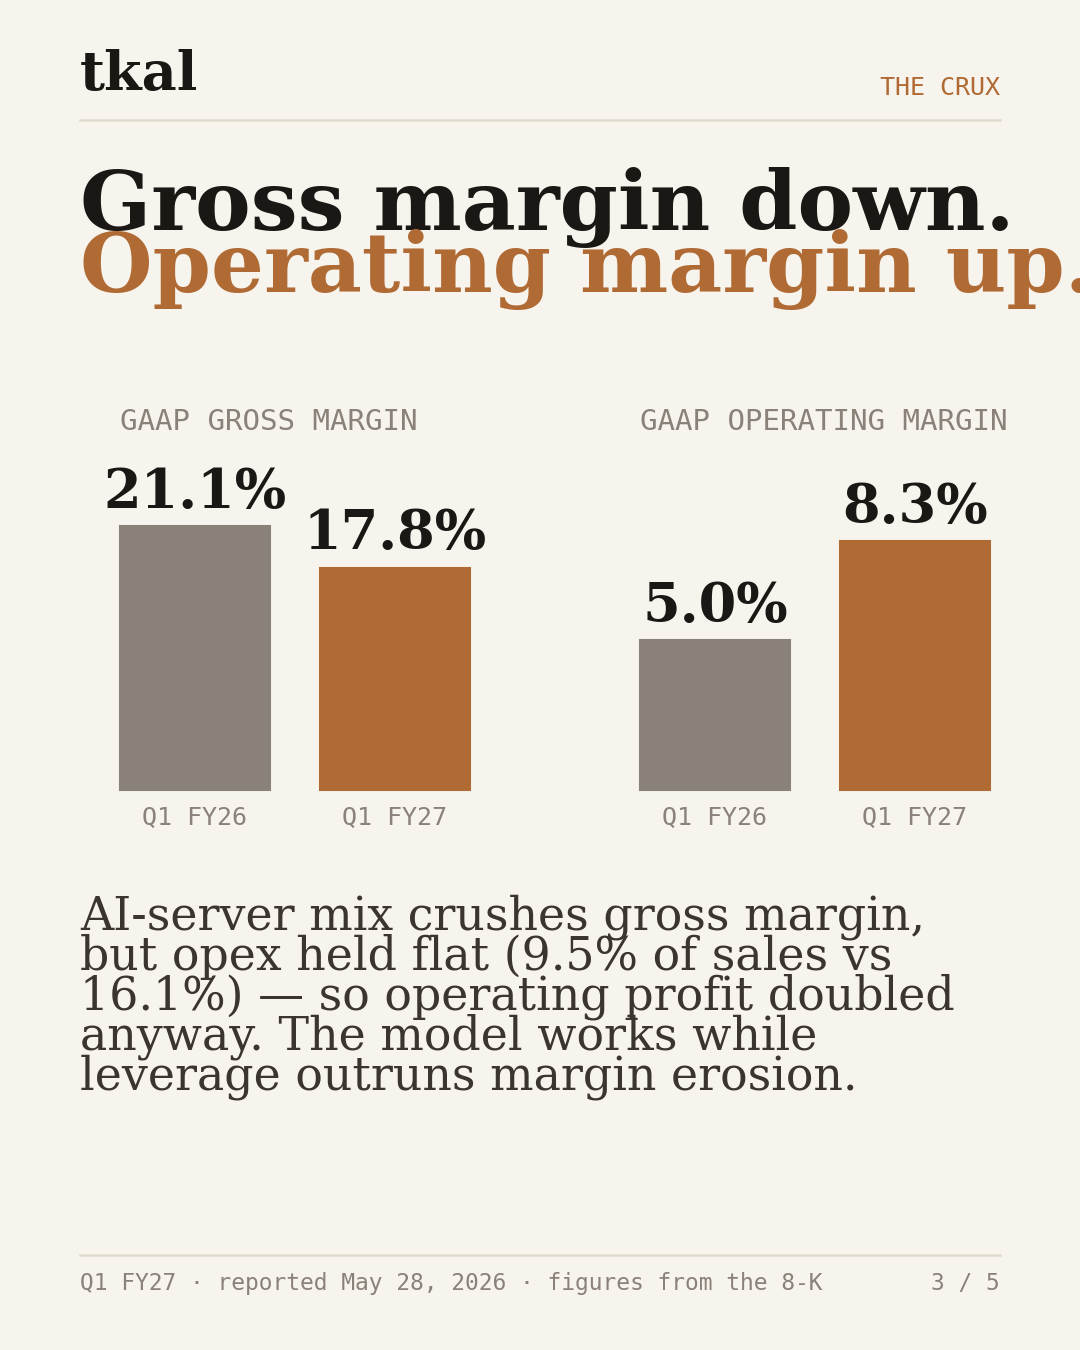
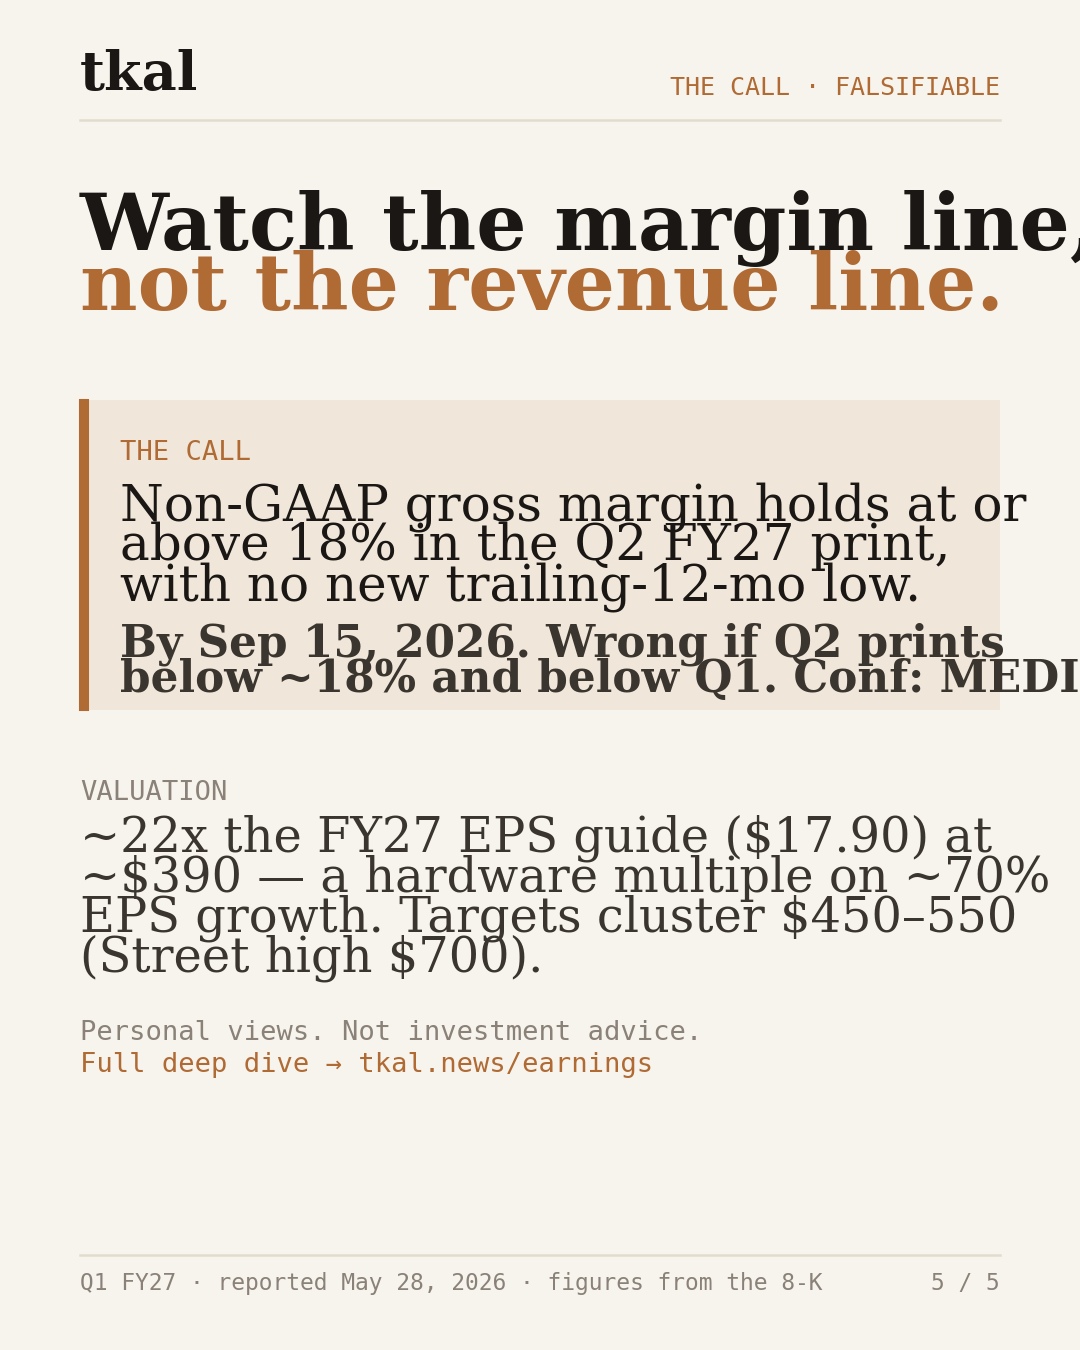
The tension sits one line up from EPS. GAAP gross margin fell to 17.8% from 21.1% a year ago; non-GAAP gross margin fell to 18.1% from 21.6% — roughly 330–350bps of compression, entirely mix-driven. Yet GAAP operating margin expanded, to 8.3% from 5.0%, because opex fell to 9.5% of revenue (8.4% non-GAAP) from 16.1%. That single divergence — gross margin down, operating margin up — is the most important fact in the release, and it's why the bulls and bears can both cite this print.
Dell is converting a low-margin revenue mix into rising operating profit by holding opex flat against a near-doubling of sales. The model works as long as that operating leverage keeps outrunning gross-margin erosion. The Q2/Q3 question is whether it does.
The rest of this dive is for paid subscribers.
The headline numbers are above. The 6 sections below carry the mechanism, the peer read, the valuation work, and the dated tests that decide it.
- What's actually driving it
- How peers read this
- Valuation reality check
- What we'd watch from here
- Listed-market read-through
- Bottom line
Already a subscriber? Sign in.