
The setup
Anthropic filed its Form S-1 on , and the headline in every feed was a number: an $80.7B net loss for the first half of 2026. Read the statement and that loss is not the story. Operating loss for the six months was $693M. Of the $80.75B net loss, $72.39B is one line, the change in fair value of convertible notes, derivative liabilities and SAFEs, and $8.76B is another, other expense. Everything else nets to roughly zero.
This dive follows the money instead: who put in $110.4B of equity in six months, who lent against what, how a $6.2B pile of Amazon notes came to sit on the balance sheet at $108.6B, and what the company has signed that it must pay whether or not the revenue shows up. We also tie it to the prints already on this site, because every dollar Anthropic commits is a dollar of backlog on someone else’s page: NVIDIA, Broadcom, AMD, Amazon, Alphabet, Microsoft, SpaceX and the neoclouds.
Put the lead number in its series. Q2 2026 revenue was $11.56B, up 1,368% on the year from $787M and 144% on the quarter from $4.73B. Q2 added $6.82B of revenue on the quarter, which is more than all of 2025 ($4.59B). The prior largest quarterly add was $2.69B in Q1 2026. First-half revenue of $16.29B is 3.55 times the whole of 2025. Q2 was also the first quarter with operating income, $974M, after losses in each of the five quarters before it.
Our call, stated now so it can be graded: Q3 2026 GAAP operating margin prints below Q2’s 8.4%. Wrong if the amended S-1, the pricing prospectus or the first 10-Q shows Q3 GAAP operating income at 8.4% of revenue or higher. The reasons are in the sections below, and the largest one is a $2.0B non-cash charge the company already disclosed for Q3.
What is not in the document matters as much as what is. This is a preliminary prospectus. The IPO price, the share count, Q3 2026 revenue, the total of the compute commitments, the contractual-obligations table and liquidity at are all blank. EDGAR shows one S-1 and no amendment as of ; the company had filed six confidential drafts since . Every figure here is from the filing as it stands, and the blanks are named where they bite.
Disclosure: this analysis was drafted with Claude, which is a product of Anthropic, the company it covers. Every number below is traced to the filing or to a prior tkal page so it can be checked without trusting the drafter.
The financing in plain English
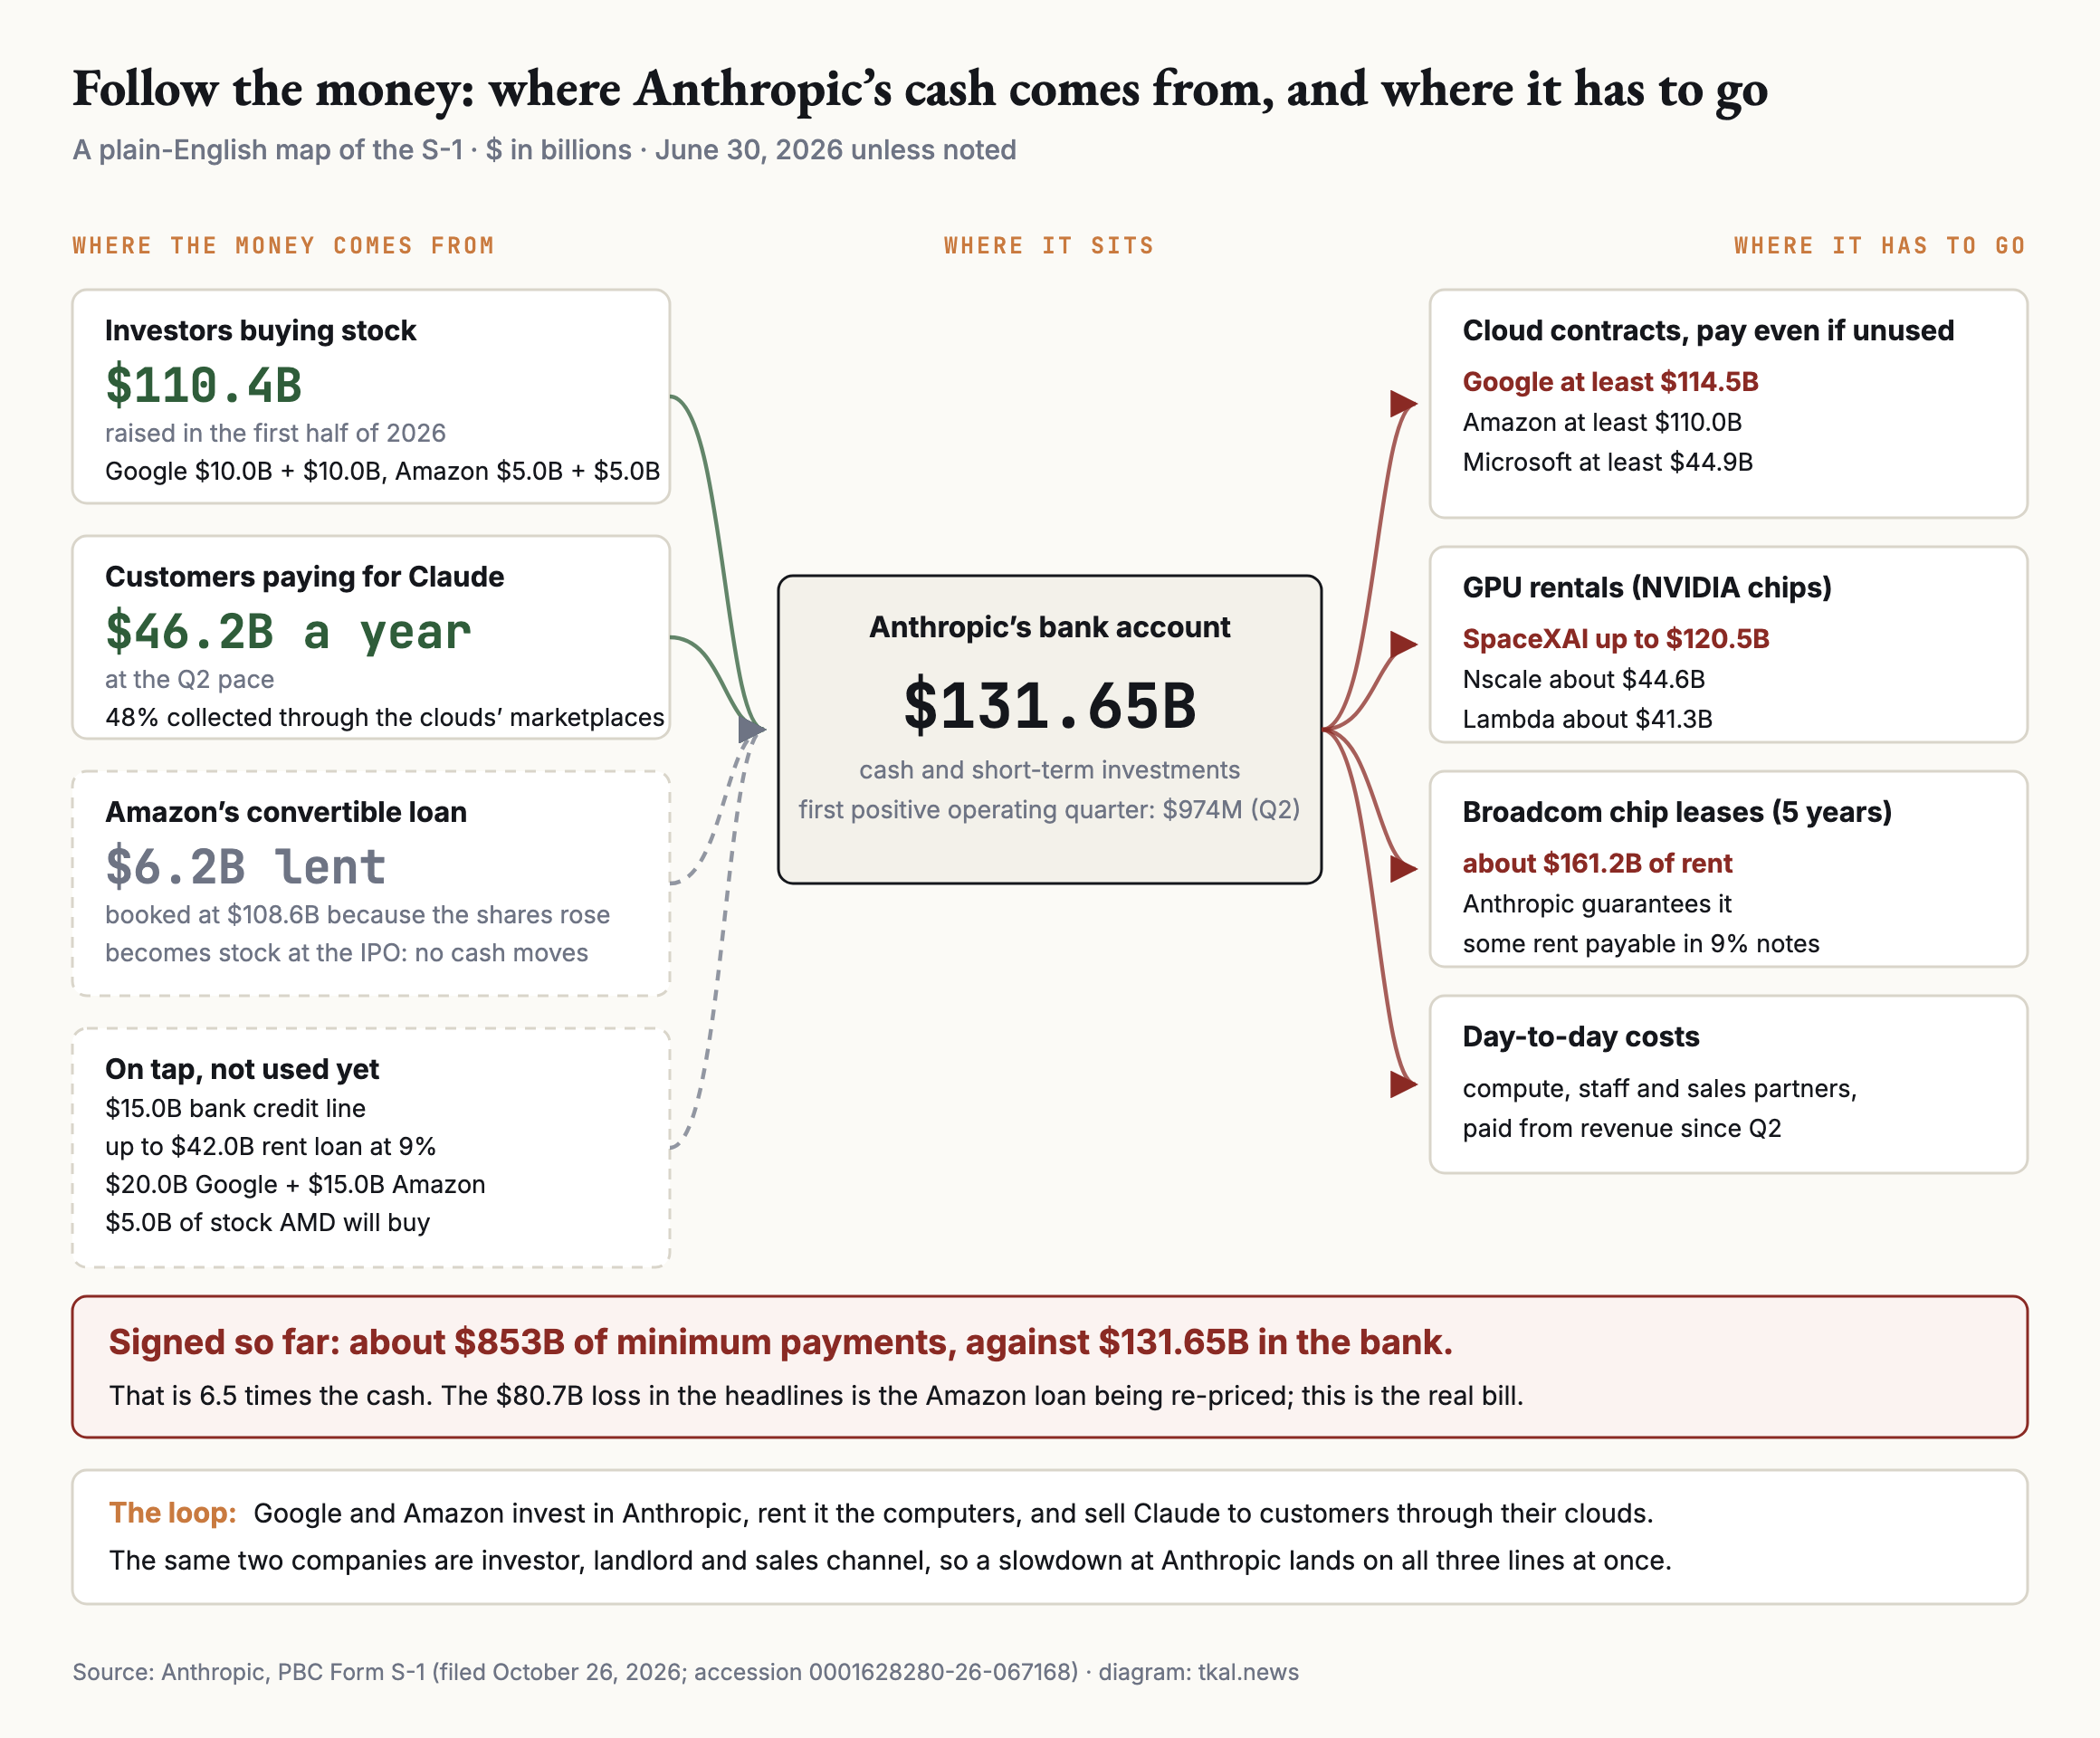
If the rest of this page is too much accounting, here is the whole thing in five lines.
- Customers. Businesses pay to use Claude. At the Q2 pace that is about $46.2B a year, and 48% of it is collected through the cloud stores run by Amazon, Google and Microsoft.
- Investors. That revenue does not yet pay for the computers. Investors do: they put in $110.4B by buying stock in the first half of 2026, and $30.0B of it came from Google and Amazon.
- The bills. Anthropic has signed about $853B of minimum payments for computers and data centers. Several of the biggest, with Google, Amazon and Microsoft, have to be paid even if the computers sit idle. It has $131.65B in the bank.
- The scary loss. Most of the $80.7B loss is not money that left. Amazon lent $6.2B in a form that turns into shares. The shares became worth more, so the books now carry that IOU at $108.6B. It becomes stock at the IPO and the charge stops.
- The loop. Google and Amazon are investor, landlord and sales channel at the same time. That keeps money flowing while Claude grows, and it means a slowdown would hit all three relationships at once.
Three terms you will meet below. A convertible note is a loan that turns into shares. A fair-value mark is re-pricing that loan at today’s share price, which is where the big loss comes from. A minimum commitment is a contract you pay for even if you do not use what you bought.
The numbers
| Revenue | Q2’26 11,555 · Q1’26 4,731 · Q2’25 787 · H1’26 16,286 · FY25 4,585 |
| Consumption · subscription (H1’26) | 13,064 · 3,222 (80% · 20%) |
| Compute and infrastructure | Q2 5,558 (48% of revenue) · Q1 3,387 (72%) · Q2’25 1,390 (177%) |
| Personnel · of which stock comp | Q2 1,857 · 1,261 |
| Sales, marketing, partnerships | Q2 2,135 (18%) · Q1 1,033 |
| Operating income (loss) | Q2 974 · Q1 (1,667) · Q2’25 (1,200) · H1’26 (693) |
| Adjusted operating income (non-GAAP) | Q2 2,235 (19% margin) · Q1 (617) · H1’26 1,618 |
| Change in fair value of notes, derivatives | Q2 (59,597) · Q1 (12,791) · H1’26 (72,388) |
| Net loss | Q2 (66,309) · Q1 (14,439) · H1’26 (80,748) |
| Operating cash flow · investing · financing (H1’26) | 3,929 · (17,181) · 110,774 |
| Cash and equivalents · short-term investments | 112,389 · 19,262 () |
| Remaining performance obligations · deferred revenue | 10.8B (75% inside 12 months) · 1,650 |
Start with the cost structure, because it is the thing the company wants read. Compute and infrastructure ran at 251% of revenue in Q1 2025 and 48% in Q2 2026. Revenue passed the compute line in Q1 2026 and opened a $6.0B gap in Q2. The mechanism is in the filing, and it is not a story about efficiency alone: the compute base is committed 12 to 18 months ahead and does not move with demand, so when revenue grew 144% in a quarter and compute grew 64%, the ratio fell by half.
The Sankey is Q2 only, because Q2 is the only quarter with an operating profit to draw. It also shows what the Sankey cannot: of every revenue dollar, 48 cents paid for compute, 16 paid personnel, 18 paid channel partners and marketing, and 9 paid everything else, leaving 8 cents of operating income and 7 of interest on a $131.7B cash pile. The filed net loss for that quarter was $66.31B, and nothing in the flow explains it. The explanation sits below the line, in the next section.
The adjusted number carries two assumptions. Adjusted operating income in Q2 was $2.24B, a 19% margin, against GAAP operating income of $0.97B. Decode the gap: it is $1.26B of stock compensation added back. Stock compensation was $105M in Q1 2025 and $1.26B in Q2 2026, twelve times in five quarters, and the filing flags that 91 million RSUs granted after carry a $5.8B grant-date value and a performance condition that is satisfied when the registration statement goes effective. The catch-up charge for those RSUs is a Q4 event the pro forma columns leave blank.
Sales, marketing and partnerships is the line to read twice. It went from $120M in the first half of 2025 to $3.17B in the first half of 2026, up 2,540%. The company attributes $2.7B of the $3.05B increase to fees paid to channel partners, which means the cloud marketplaces that collect Anthropic’s revenue keep a cut that now shows up as an expense. Marketplace sales were 48% of first-half 2026 revenue, about $7.8B on the filed percentage. Decode the line: the biggest cost growth in the company is the toll its own distributors charge, and the distributors are also its investors and compute vendors. We come back to who those channels are.
The rest of this dive is for paid subscribers.
The headline numbers are above. The sections below carry the funding stack, the convertible-note mark, the commitments, the tie-out to the other prints, the valuation work, and the dated tests that decide it.
- Where the money came from
- The writedown that is not cash
- The debt that is not called debt
- Connecting the dots
- What the S-1 leaves out
- Valuation reality check
- The strongest case against us
- What we’d watch from here
- Bottom line
Not ready to pay? Get the free Monday issue and one full dive a week by email.
Already a subscriber? Sign in.